 4
4peptides
spectra
0.000 | 0.007
0.000 | 0.027
0.223 | 0.461
0.000 | 0.134
0.000 | 0.281
0.021 | 0.402
0.173 | 0.307
0.000 | 0.000
1peptide
spectra
NA | NA
NA | NA
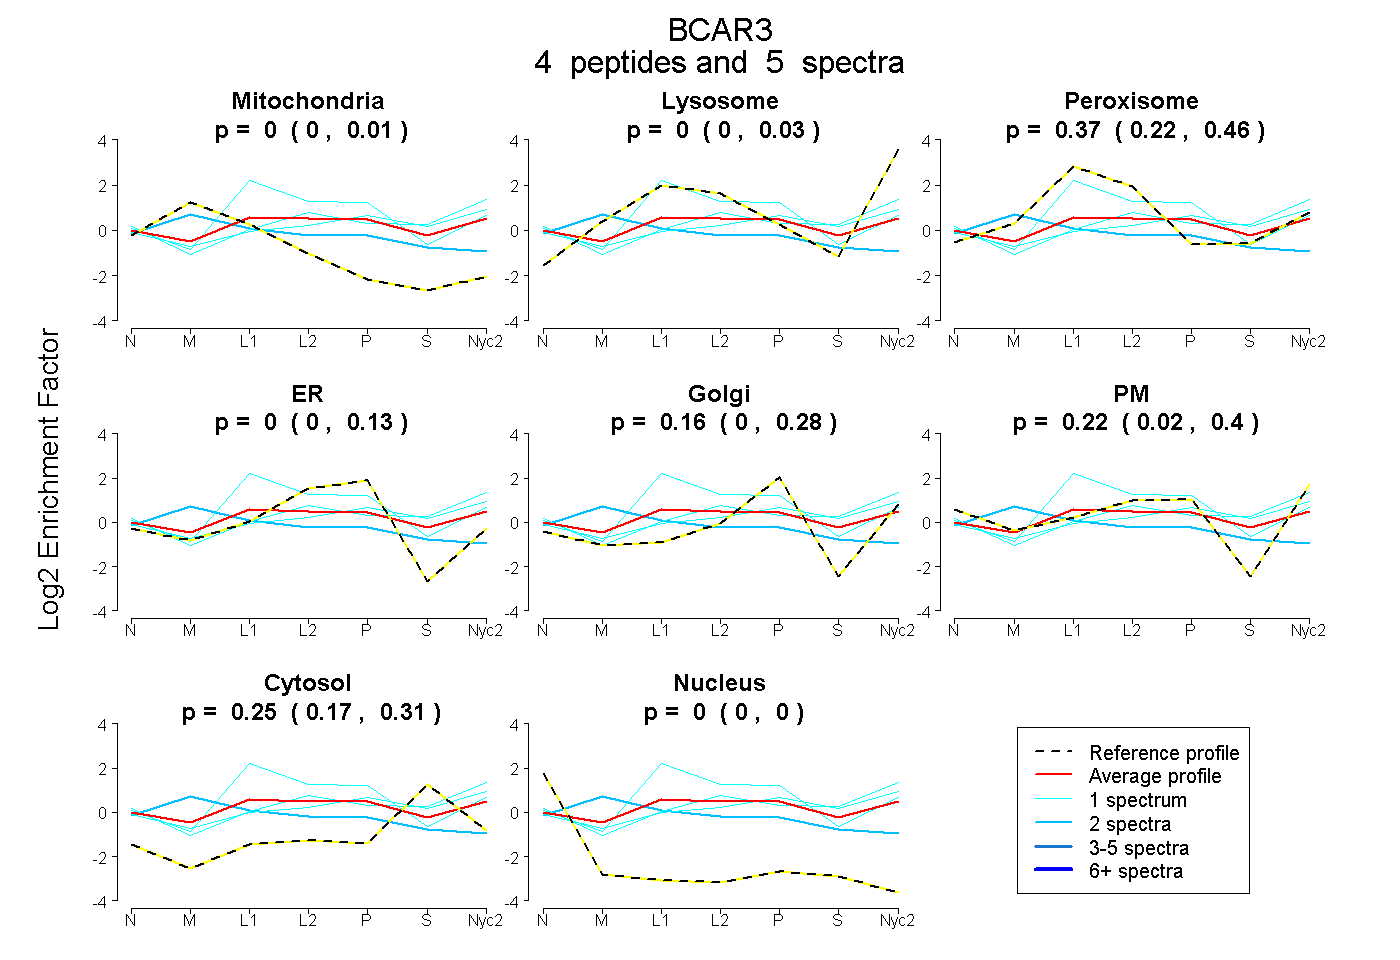
| Plot | Mito | Lyso | Perox | ER | Golgi | PM | Cytosol | Nucleus | |||||
| Expt A |
4 peptides |
5 spectra |
|
0.000 0.000 | 0.007 |
0.000 0.000 | 0.027 |
0.370 0.223 | 0.461 |
0.000 0.000 | 0.134 |
0.159 0.000 | 0.281 |
0.225 0.021 | 0.402 |
0.246 0.173 | 0.307 |
0.000 0.000 | 0.000 |
||
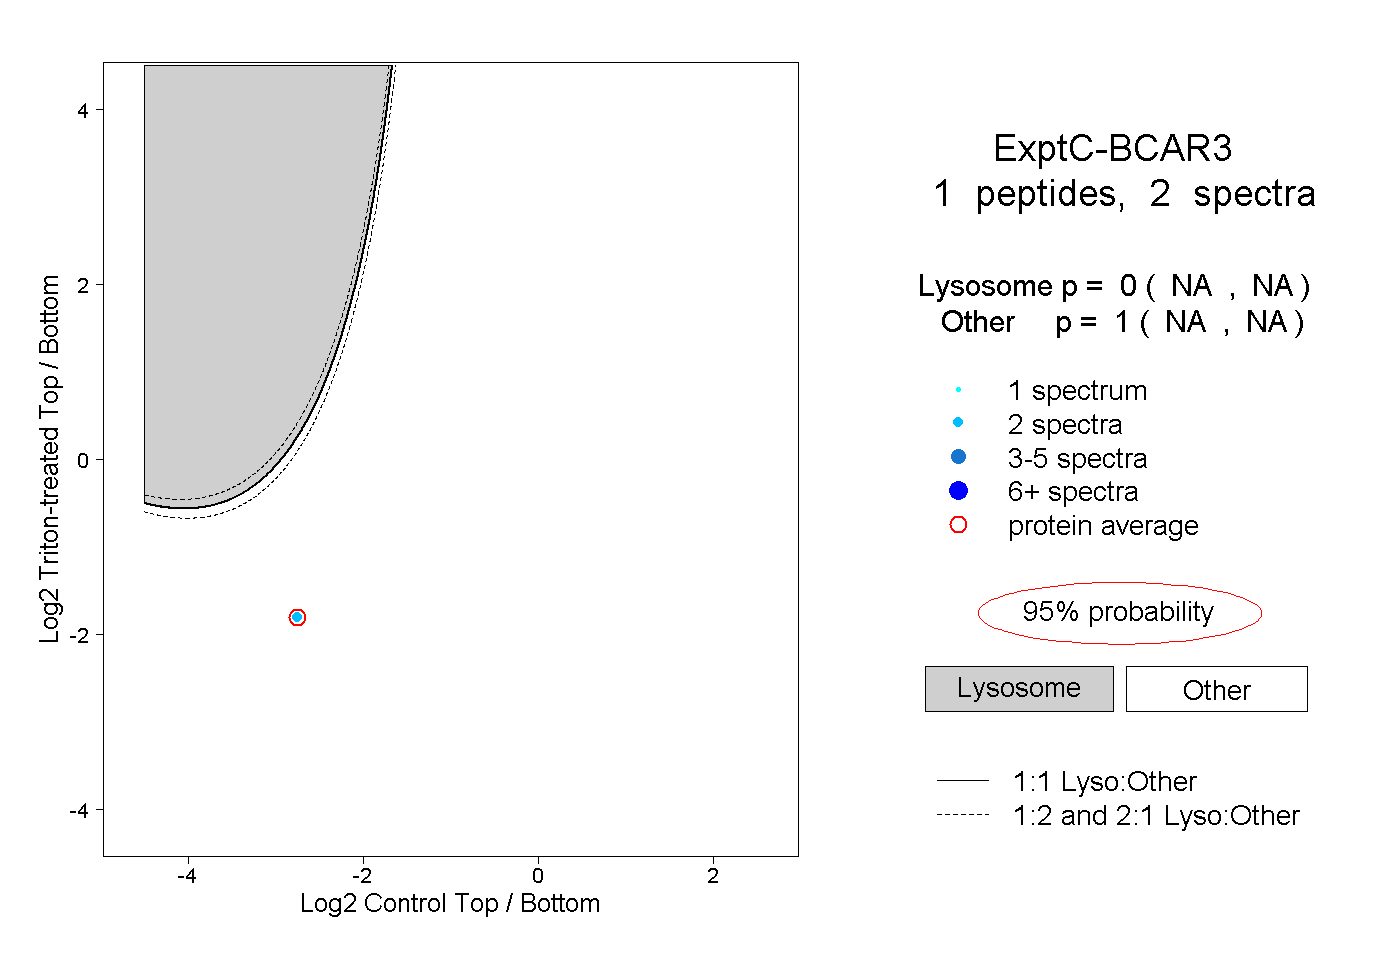
| Plot | Lyso | Other | |||||||||||
| Expt C |
1 peptide |
2 spectra |
|
0.000 NA | NA |
1.000 NA | NA |