 10
10peptides
spectra
0.000 | 0.000
0.913 | 0.923
0.000 | 0.000
0.000 | 0.000
0.000 | 0.000
0.000 | 0.000
0.077 | 0.087
0.000 | 0.000
| Plot | Mito | Lyso | Perox | ER | Golgi | PM | Cytosol | Nucleus | |||||
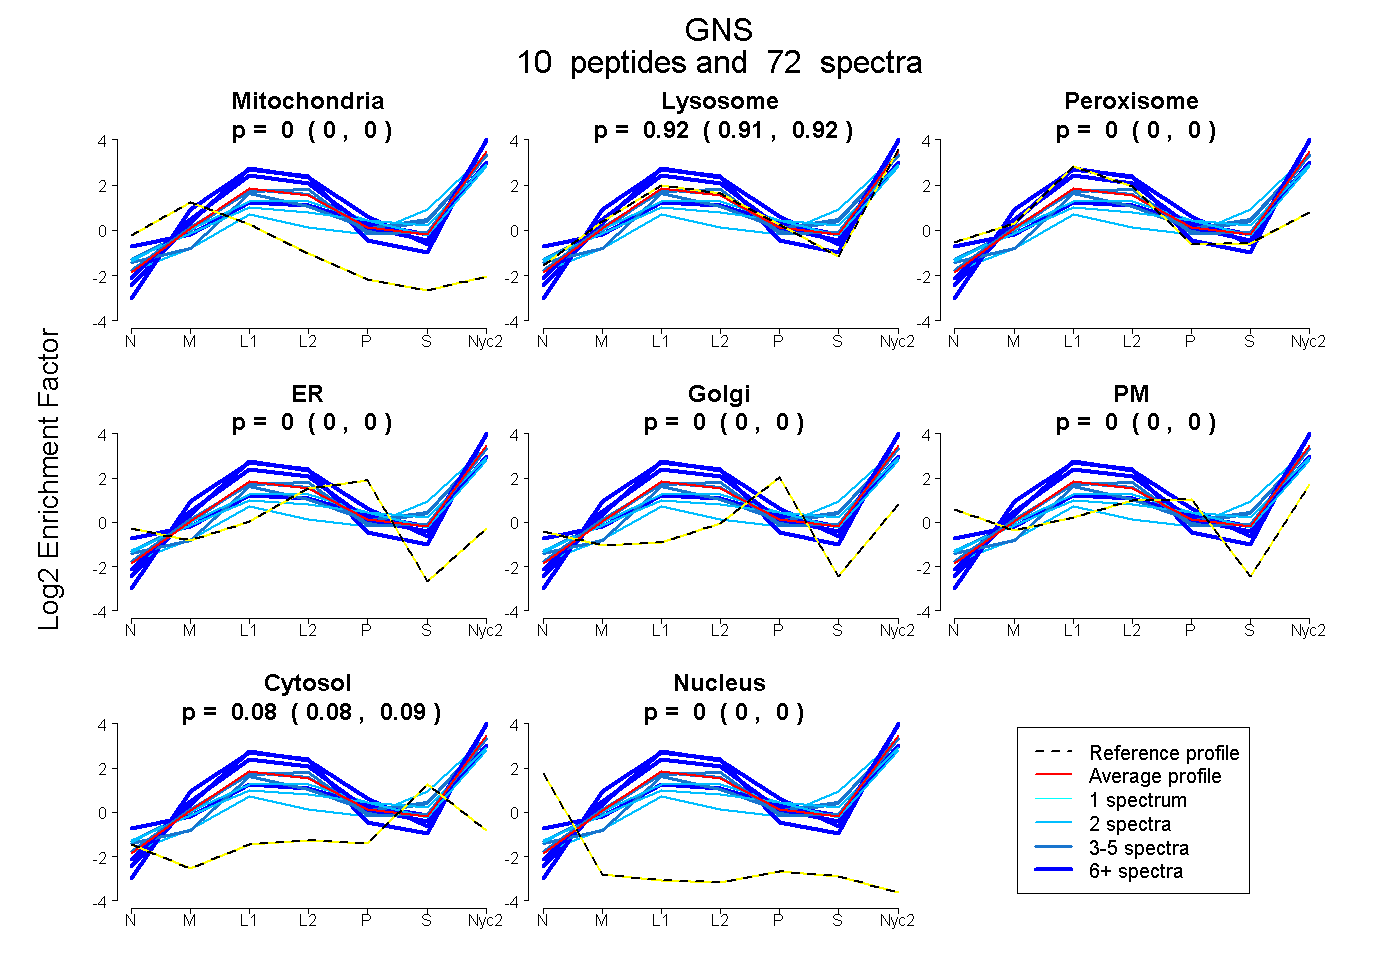
| Expt A |
10 peptides |
72 spectra |
|
0.000 0.000 | 0.000 |
0.918 0.913 | 0.923 |
0.000 0.000 | 0.000 |
0.000 0.000 | 0.000 |
0.000 0.000 | 0.000 |
0.000 0.000 | 0.000 |
0.082 0.077 | 0.087 |
0.000 0.000 | 0.000 |
| 2 spectra, QLYEFDIK | 0.000 | 0.816 | 0.000 | 0.000 | 0.000 | 0.000 | 0.184 | 0.000 | ||
| 21 spectra, AFPNVIAPR | 0.000 | 1.000 | 0.000 | 0.000 | 0.000 | 0.000 | 0.000 | 0.000 | ||
| 8 spectra, LMMLQSCSGPTCR | 0.000 | 0.747 | 0.000 | 0.000 | 0.000 | 0.085 | 0.168 | 0.000 | ||
| 8 spectra, FLDDAFR | 0.000 | 1.000 | 0.000 | 0.000 | 0.000 | 0.000 | 0.000 | 0.000 | ||
| 3 spectra, ASILTGK | 0.000 | 0.828 | 0.053 | 0.000 | 0.000 | 0.000 | 0.118 | 0.000 | ||
| 2 spectra, SIDPELLGK | 0.000 | 0.747 | 0.000 | 0.000 | 0.058 | 0.000 | 0.195 | 0.000 | ||
| 4 spectra, NFNIHGTNK | 0.000 | 0.793 | 0.000 | 0.000 | 0.000 | 0.000 | 0.207 | 0.000 | ||
| 17 spectra, SDVLVEYQGEGR | 0.000 | 1.000 | 0.000 | 0.000 | 0.000 | 0.000 | 0.000 | 0.000 | ||
| 5 spectra, TQMDGTSLLPILK | 0.000 | 0.897 | 0.007 | 0.000 | 0.000 | 0.000 | 0.096 | 0.000 | ||
| 2 spectra, ALIGEK | 0.000 | 0.669 | 0.000 | 0.000 | 0.000 | 0.000 | 0.331 | 0.000 |
| Plot | Mito | Lyso or Perox | ER | Golgi | PM | Cytosol | Nucleus | ||||||
| Expt B |
11 peptides |
24 spectra |
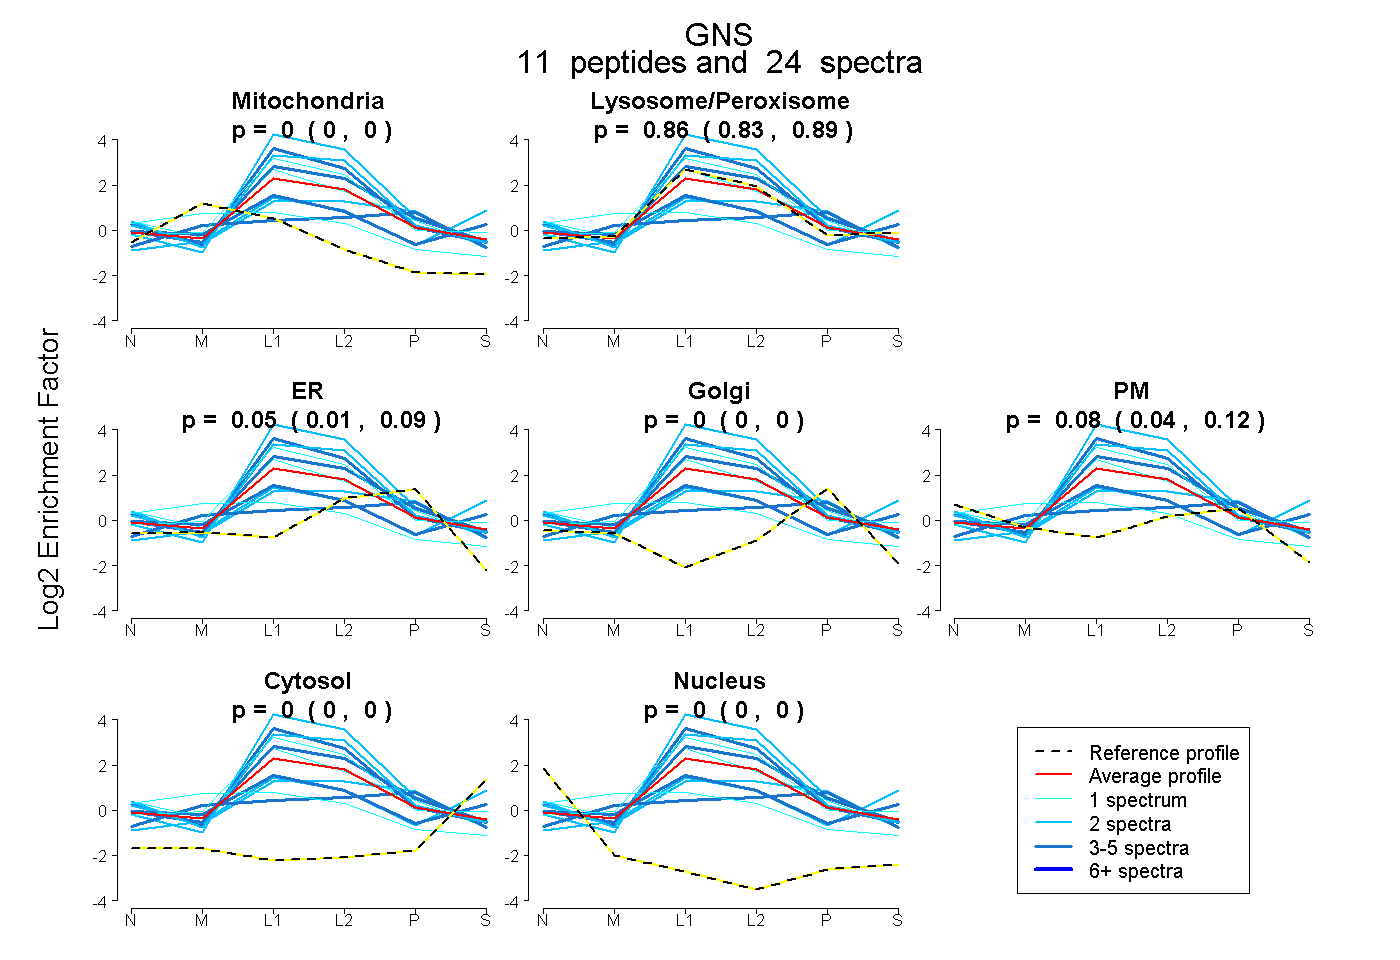 |
0.000 0.000 | 0.000 |
0.862 0.832 | 0.888 |
0.055 0.008 | 0.092 |
0.000 0.000 | 0.000 |
0.083 0.037 | 0.123 |
0.000 0.000 | 0.000 |
0.000 0.000 | 0.000 |
|||
| Plot | Lyso | Other | |||||||||||
| Expt C |
14 peptides |
354 spectra |
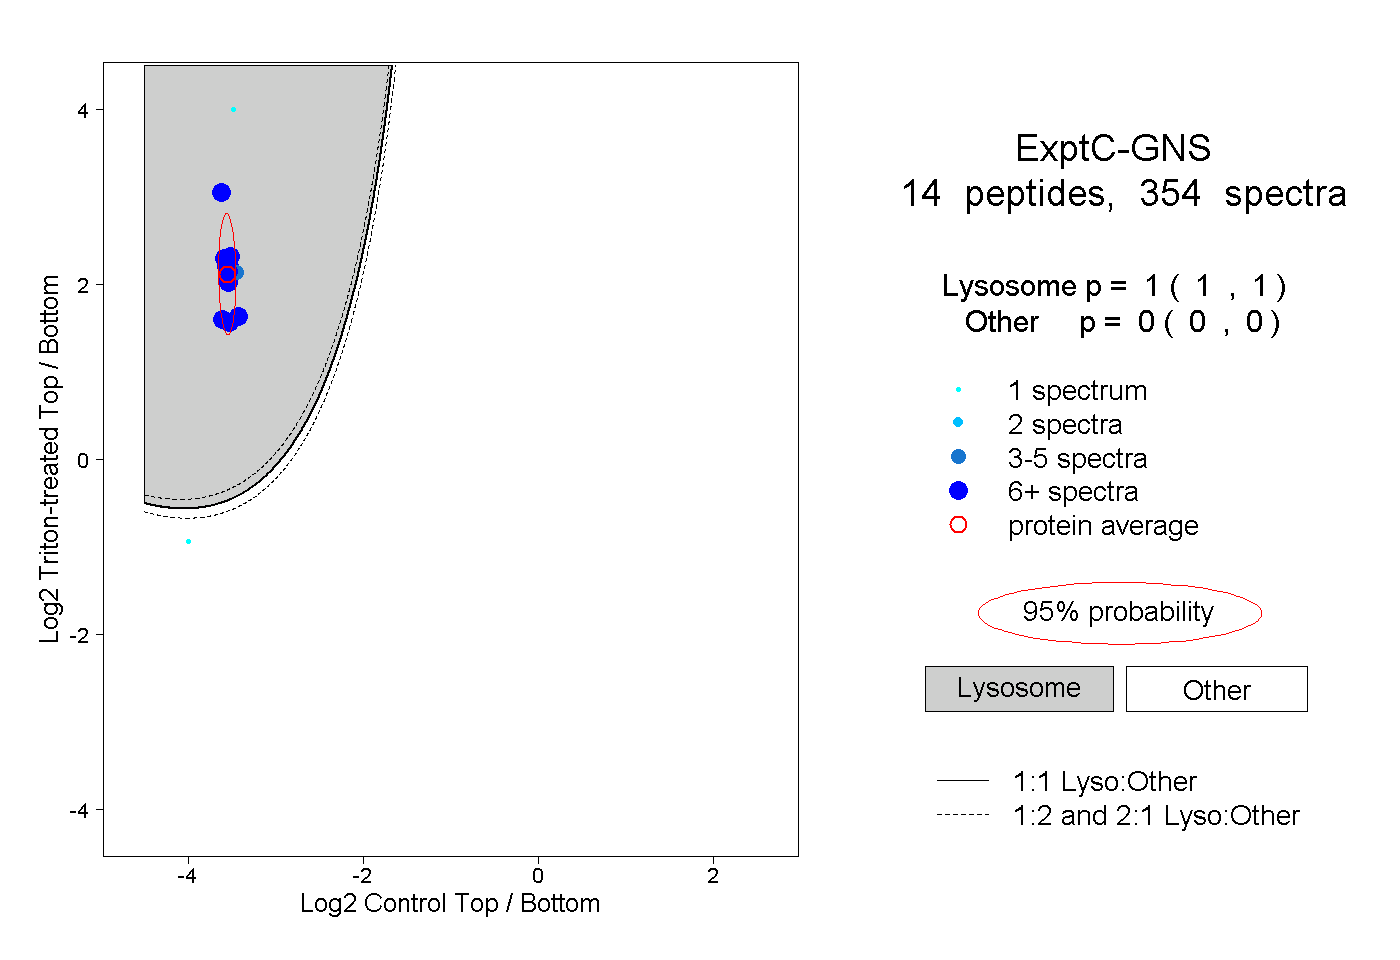 |
1.000 1.000 | 1.000 |
0.000 0.000 | 0.000 |
||||||||
| Plot | Lyso | Other | |||||||||||
| Expt D |
8 peptides |
19 spectra |
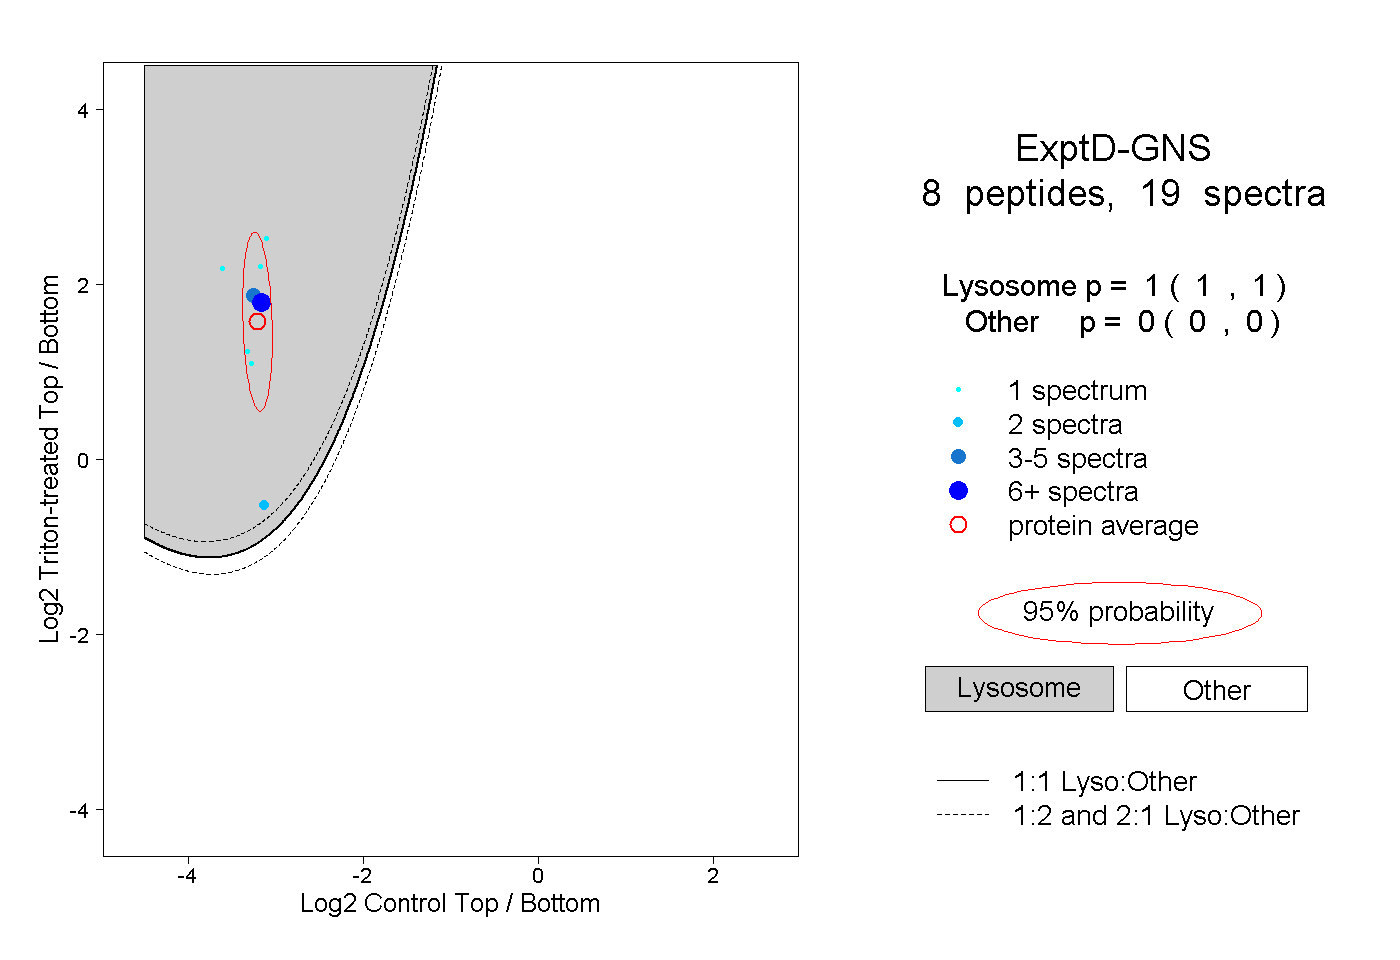 |
1.000 1.000 | 1.000 |
0.000 0.000 | 0.000 |