 4
4peptides
spectra
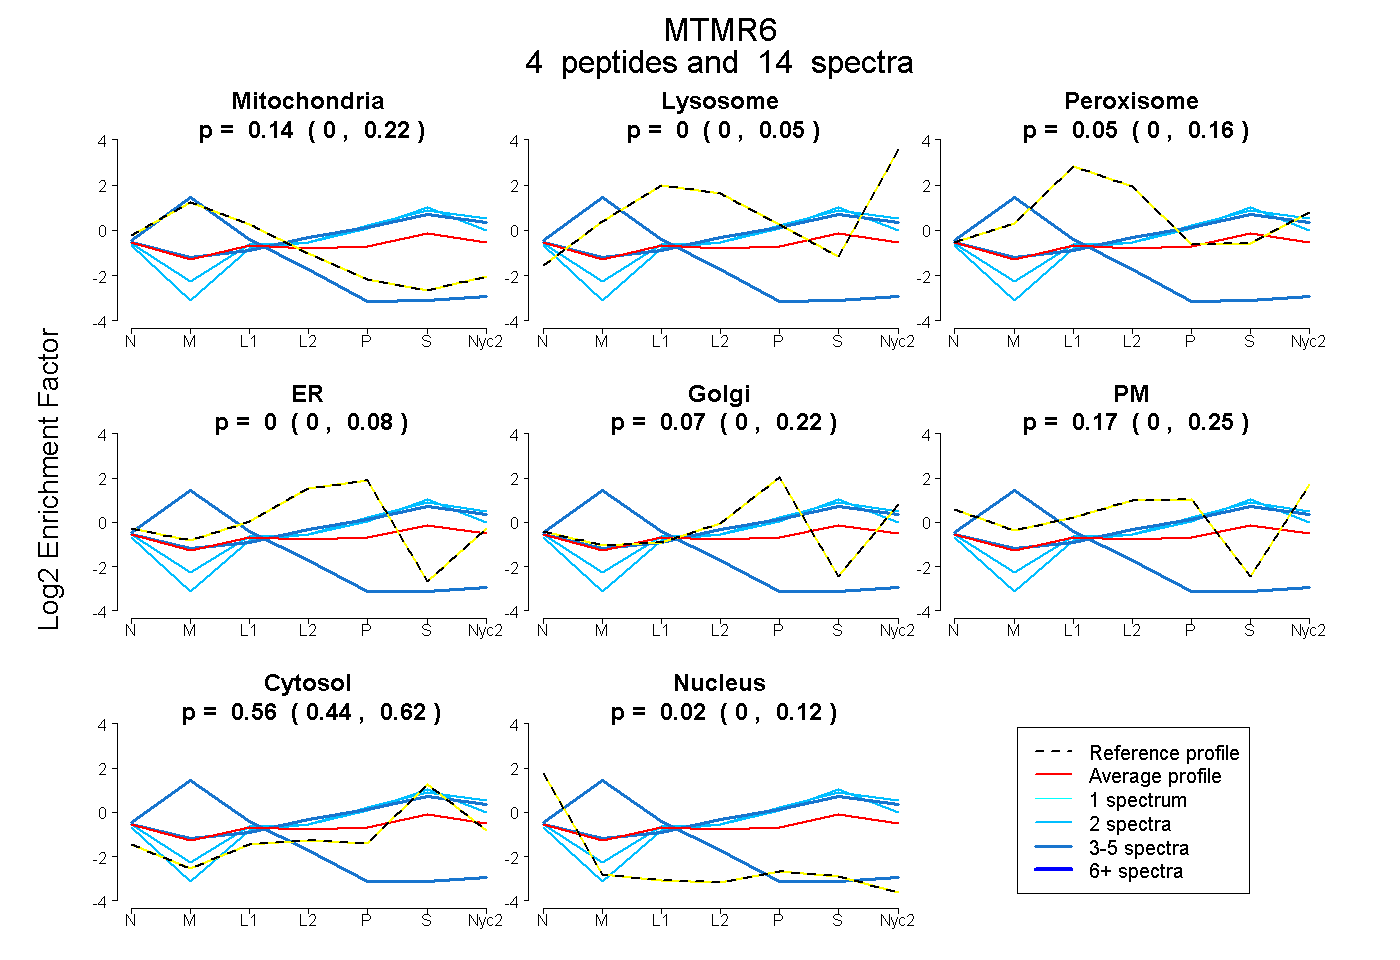
0.000 | 0.224
0.000 | 0.054
0.000 | 0.161
0.000 | 0.080
0.000 | 0.219
0.000 | 0.252
0.440 | 0.623
0.000 | 0.120
1peptide
spectrum
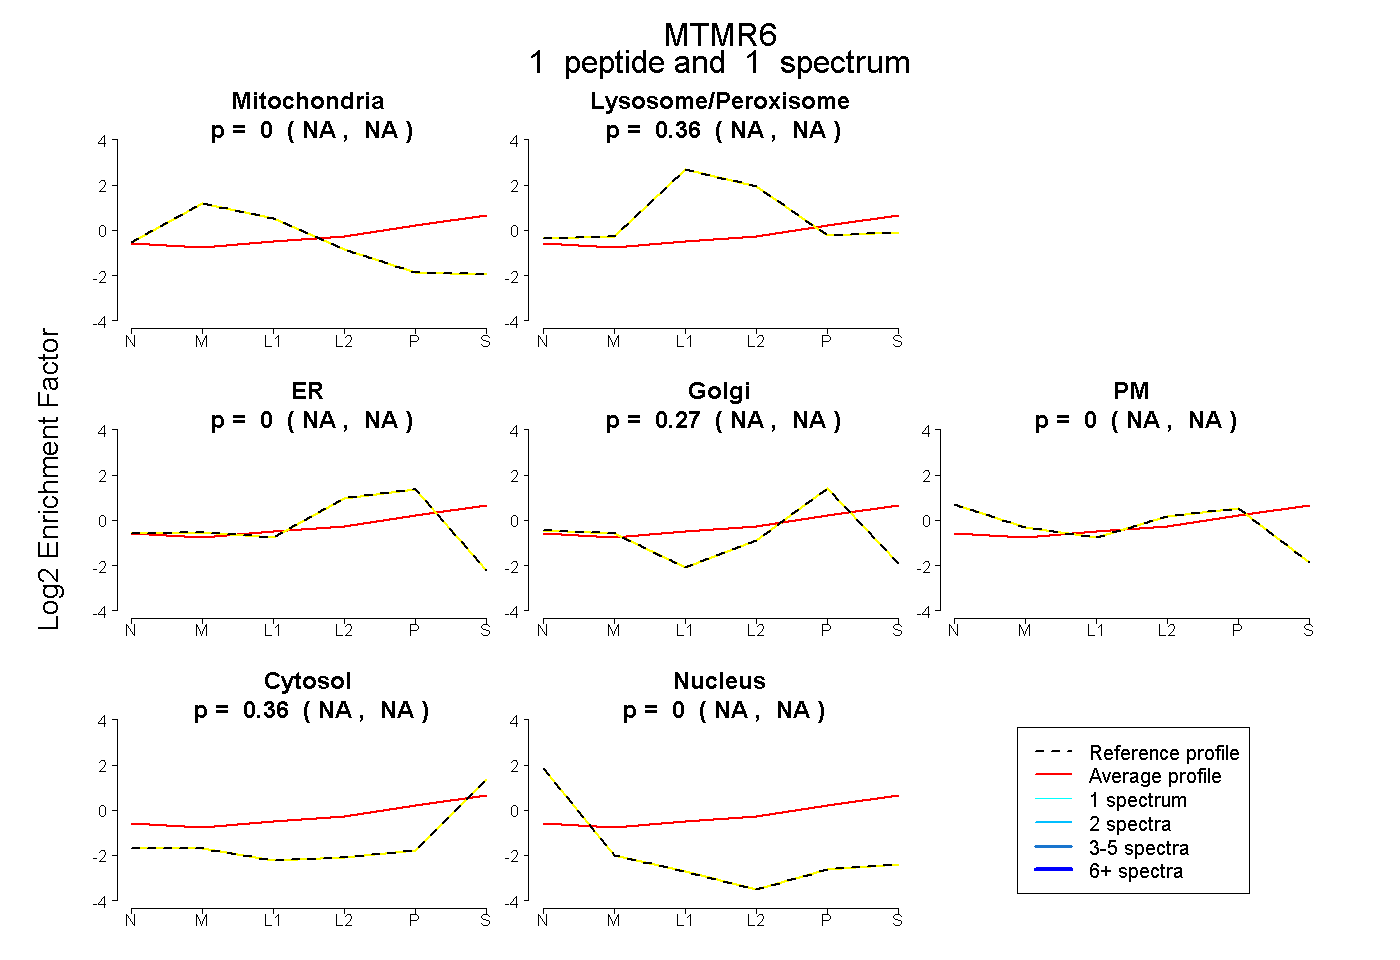
NA | NA
NA | NA
NA | NA
NA | NA
NA | NA
NA | NA
NA | NA
2peptides
spectra
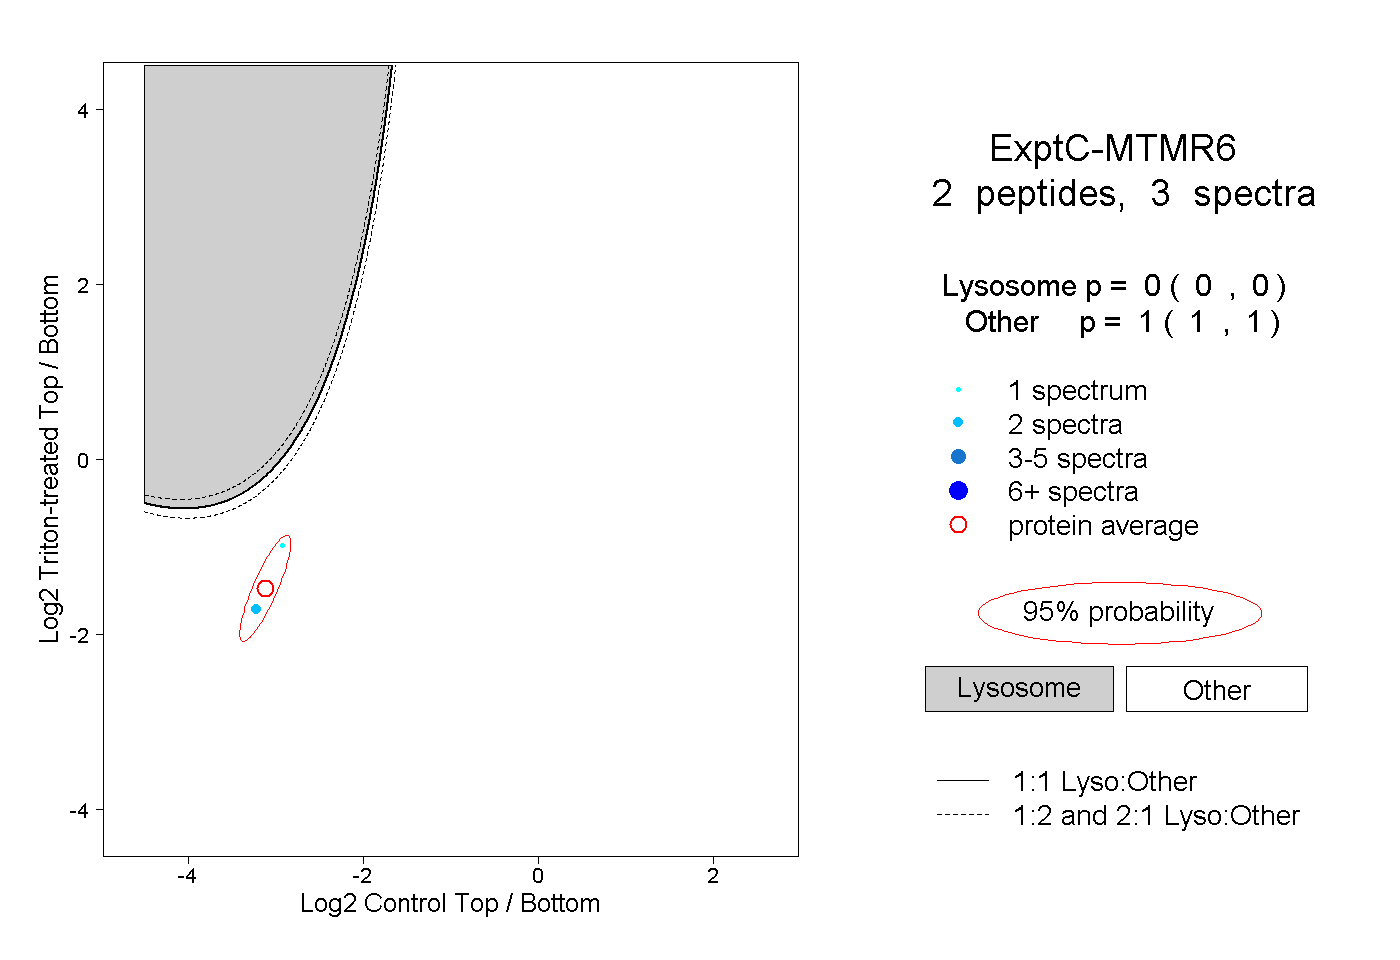
0.000 | 0.000
1.000 | 1.000