 17
17peptides
spectra
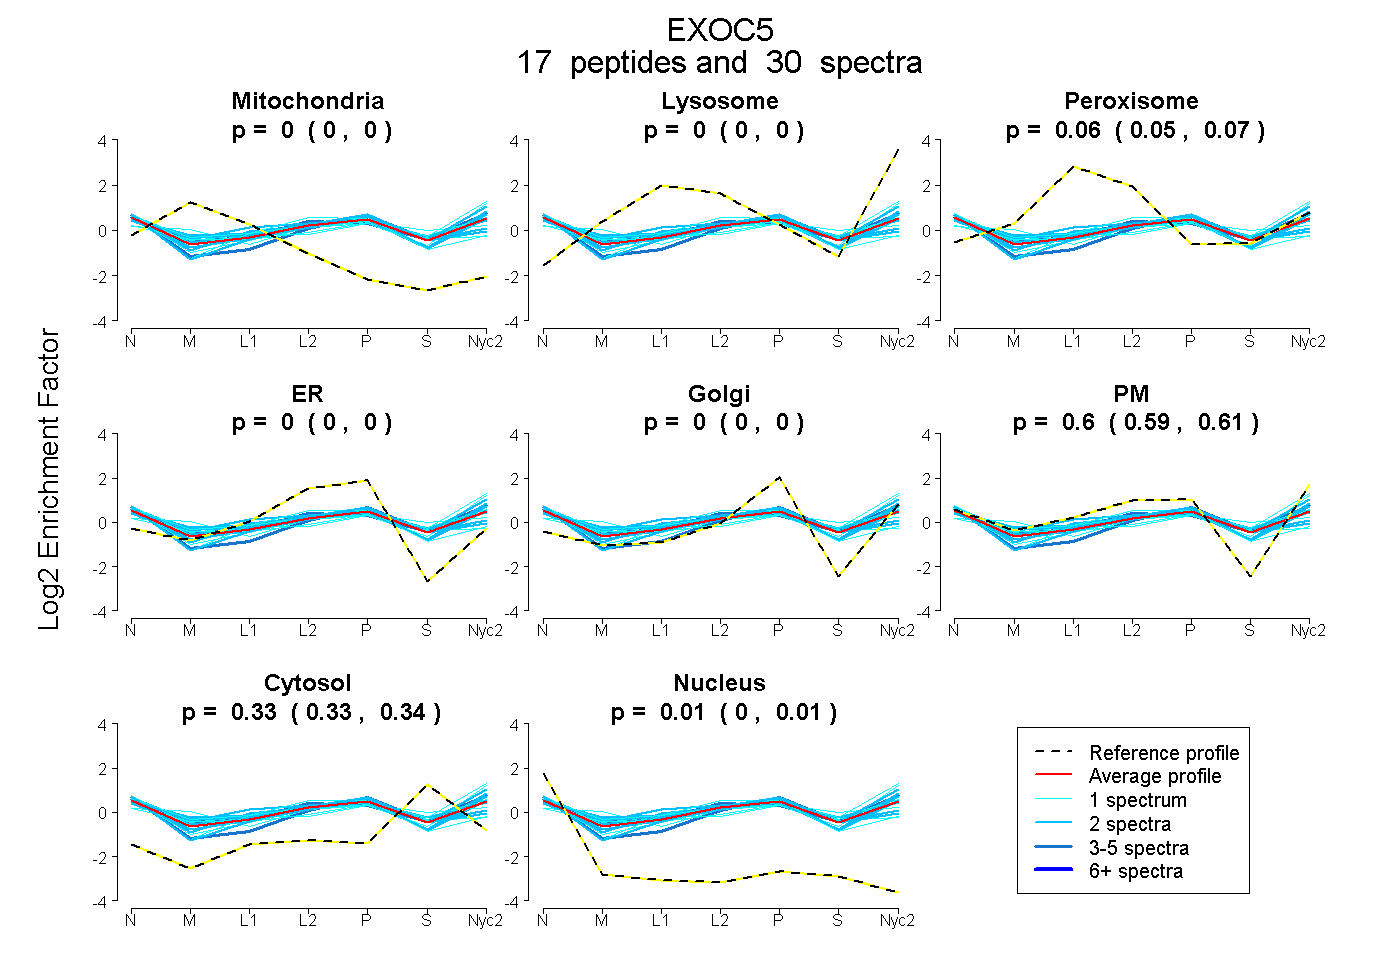
0.000 | 0.000
0.000 | 0.000
0.052 | 0.066
0.000 | 0.000
0.000 | 0.000
0.591 | 0.606
0.329 | 0.339
0.002 | 0.011
2peptides
spectra
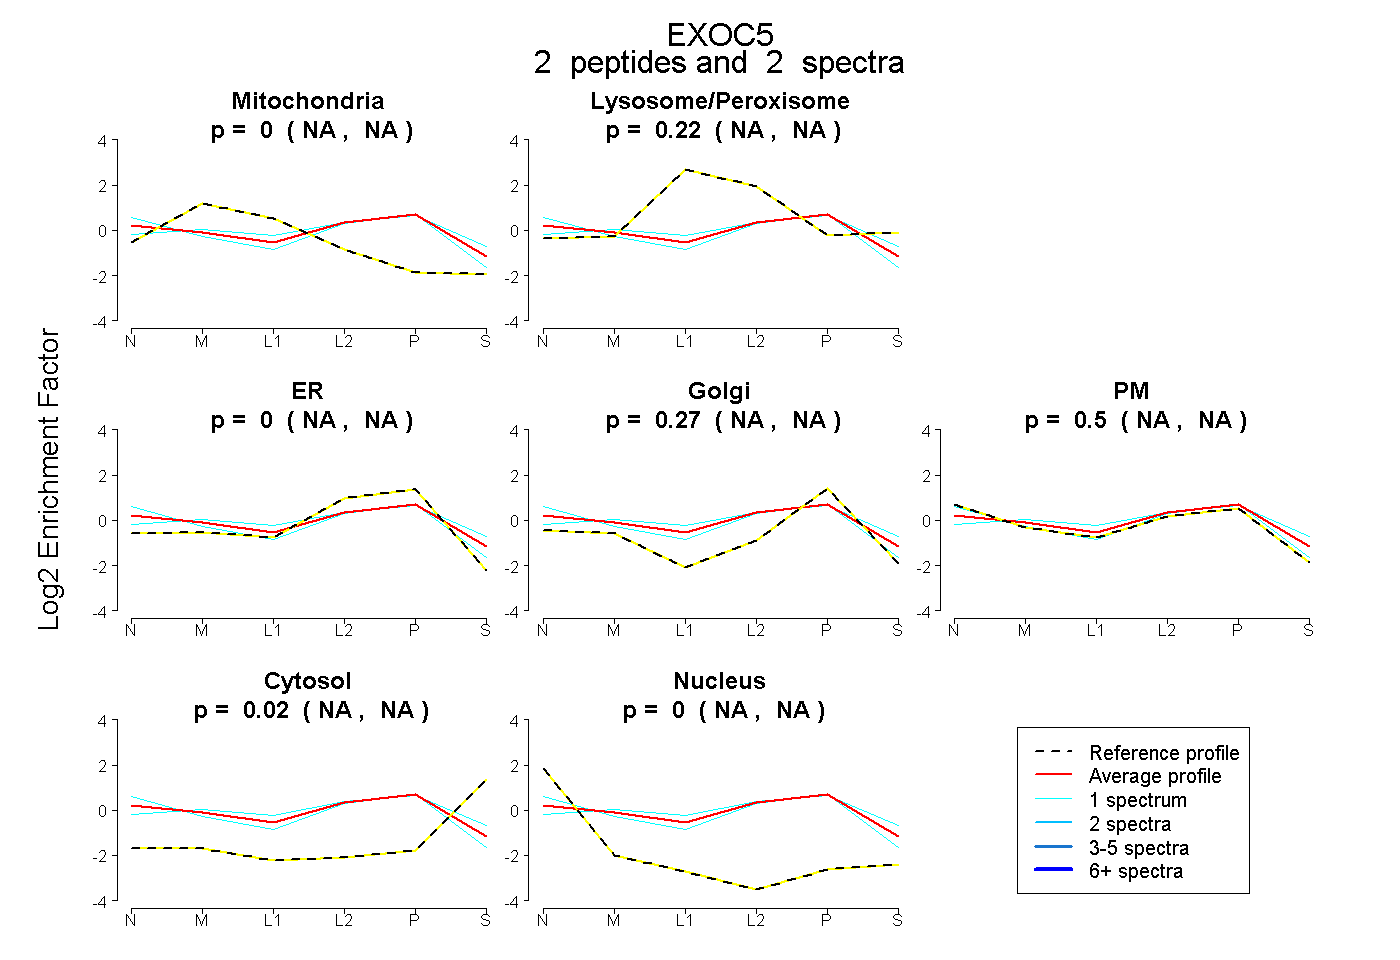
NA | NA
NA | NA
NA | NA
NA | NA
NA | NA
NA | NA
NA | NA
18peptides
spectra
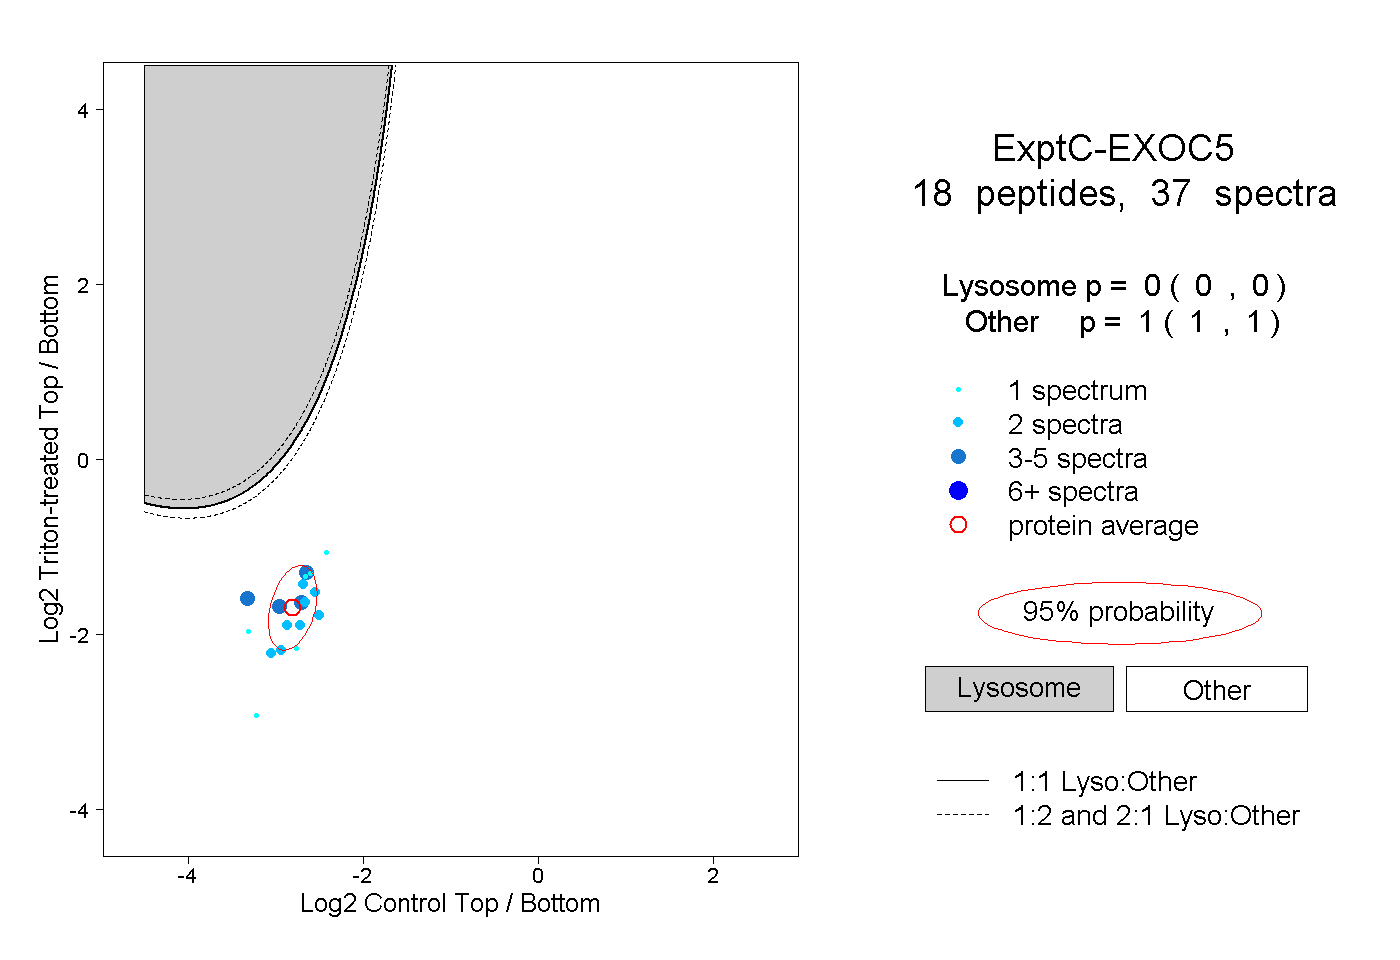
0.000 | 0.000
1.000 | 1.000
2peptides
spectra
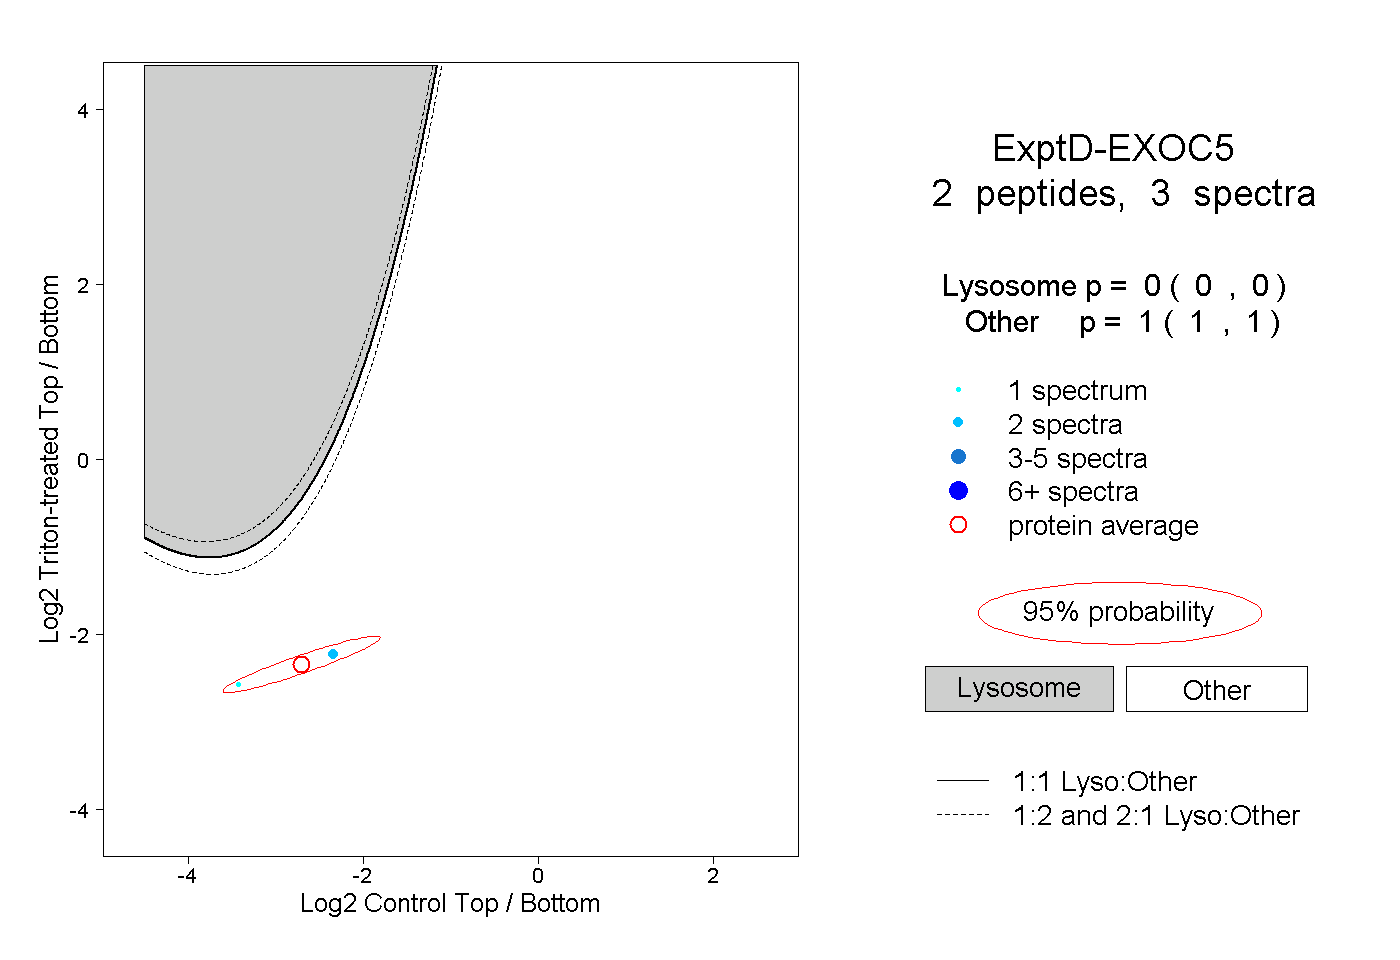
0.000 | 0.000
1.000 | 1.000