 7
7peptides
spectra
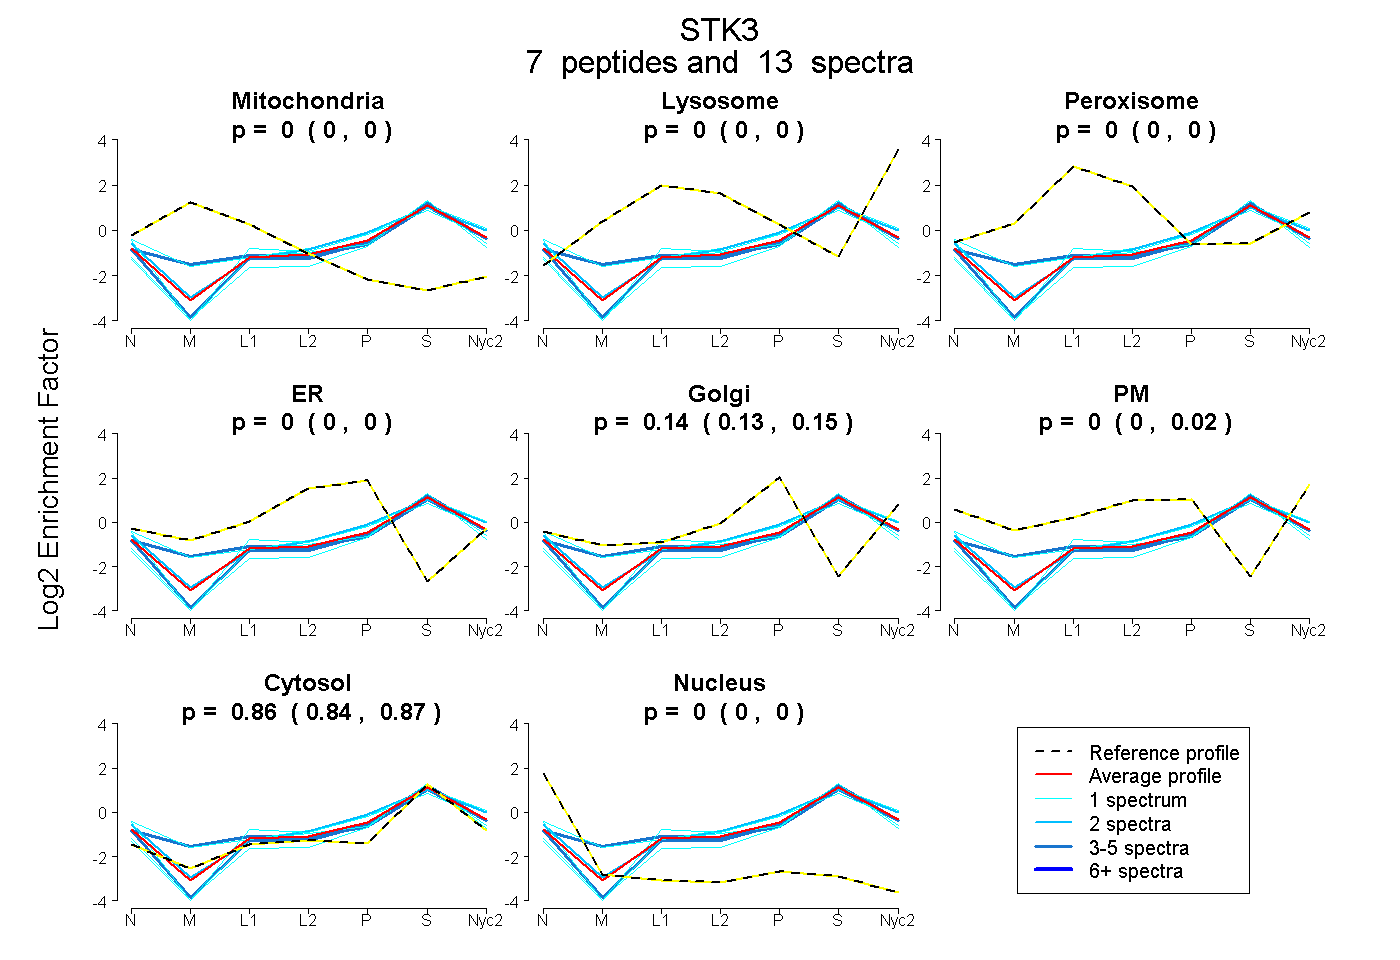
0.000 | 0.000
0.000 | 0.000
0.000 | 0.000
0.000 | 0.000
0.125 | 0.152
0.000 | 0.019
0.843 | 0.866
0.000 | 0.000
| Plot | Mito | Lyso | Perox | ER | Golgi | PM | Cytosol | Nucleus | |||||
| Expt A |
7 peptides |
13 spectra |
|
0.000 0.000 | 0.000 |
0.000 0.000 | 0.000 |
0.000 0.000 | 0.000 |
0.000 0.000 | 0.000 |
0.145 0.125 | 0.152 |
0.000 0.000 | 0.019 |
0.855 0.843 | 0.866 |
0.000 0.000 | 0.000 |
| 3 spectra, QPEEVFDVLEK | 0.000 | 0.000 | 0.000 | 0.000 | 0.079 | 0.000 | 0.921 | 0.000 | ||
| 1 spectrum, TLTEDEIATILK | 0.000 | 0.000 | 0.000 | 0.028 | 0.000 | 0.000 | 0.972 | 0.000 | ||
| 4 spectra, AGNILLNTEGHAK | 0.015 | 0.008 | 0.035 | 0.000 | 0.045 | 0.108 | 0.789 | 0.000 | ||
| 2 spectra, NLSLEELQMR | 0.000 | 0.000 | 0.000 | 0.000 | 0.202 | 0.024 | 0.774 | 0.000 | ||
| 1 spectrum, VPQDGDFDFLK | 0.000 | 0.000 | 0.000 | 0.000 | 0.106 | 0.064 | 0.830 | 0.000 | ||
| 1 spectrum, NAKPVSILR | 0.000 | 0.000 | 0.000 | 0.000 | 0.077 | 0.204 | 0.719 | 0.000 | ||
| 1 spectrum, AIFMIPTNPPPTFR | 0.000 | 0.000 | 0.000 | 0.000 | 0.012 | 0.000 | 0.981 | 0.008 |
| Plot | Mito | Lyso or Perox | ER | Golgi | PM | Cytosol | Nucleus | ||||||
| Expt B |
1 peptide |
1 spectrum |
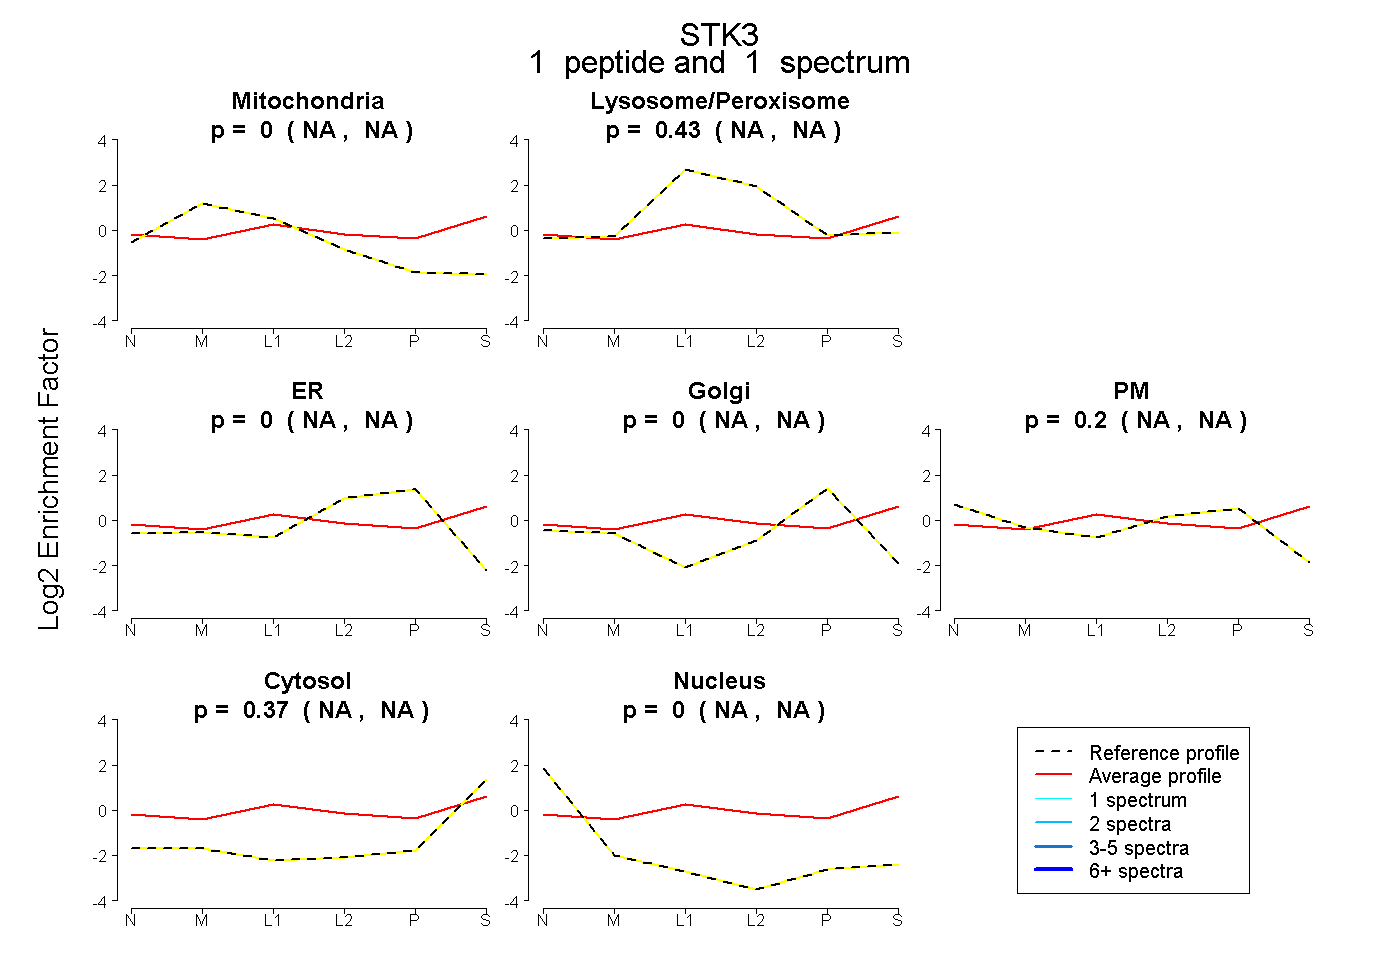 |
0.000 NA | NA |
0.433 NA | NA |
0.000 NA | NA |
0.000 NA | NA |
0.202 NA | NA |
0.365 NA | NA |
0.000 NA | NA |
|||
| Plot | Lyso | Other | |||||||||||
| Expt C |
1 peptide |
1 spectrum |
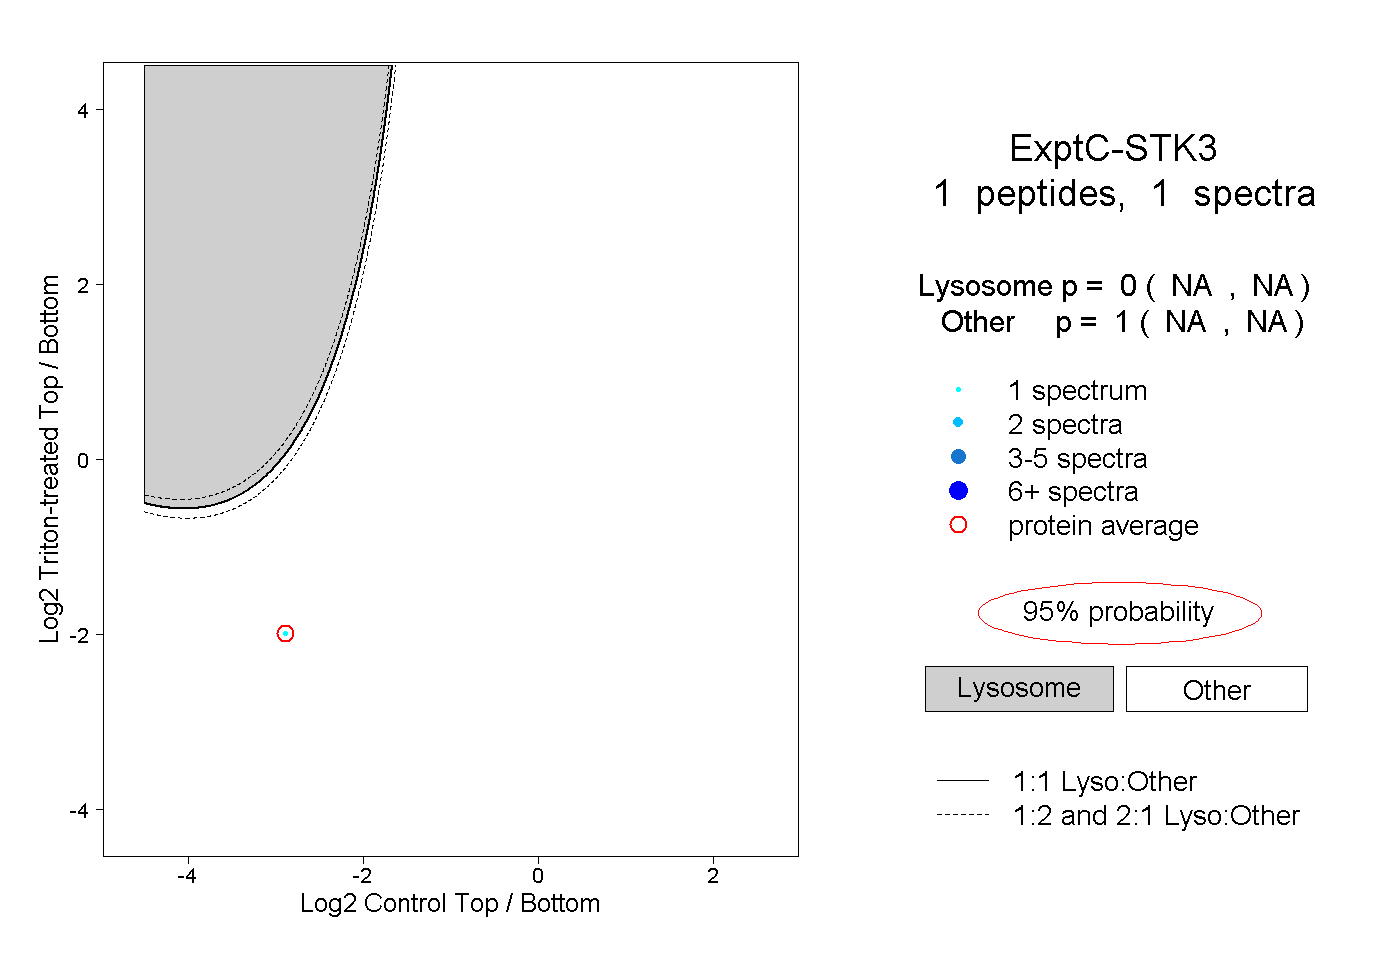 |
0.000 NA | NA |
1.000 NA | NA |