 3
3peptides
spectra
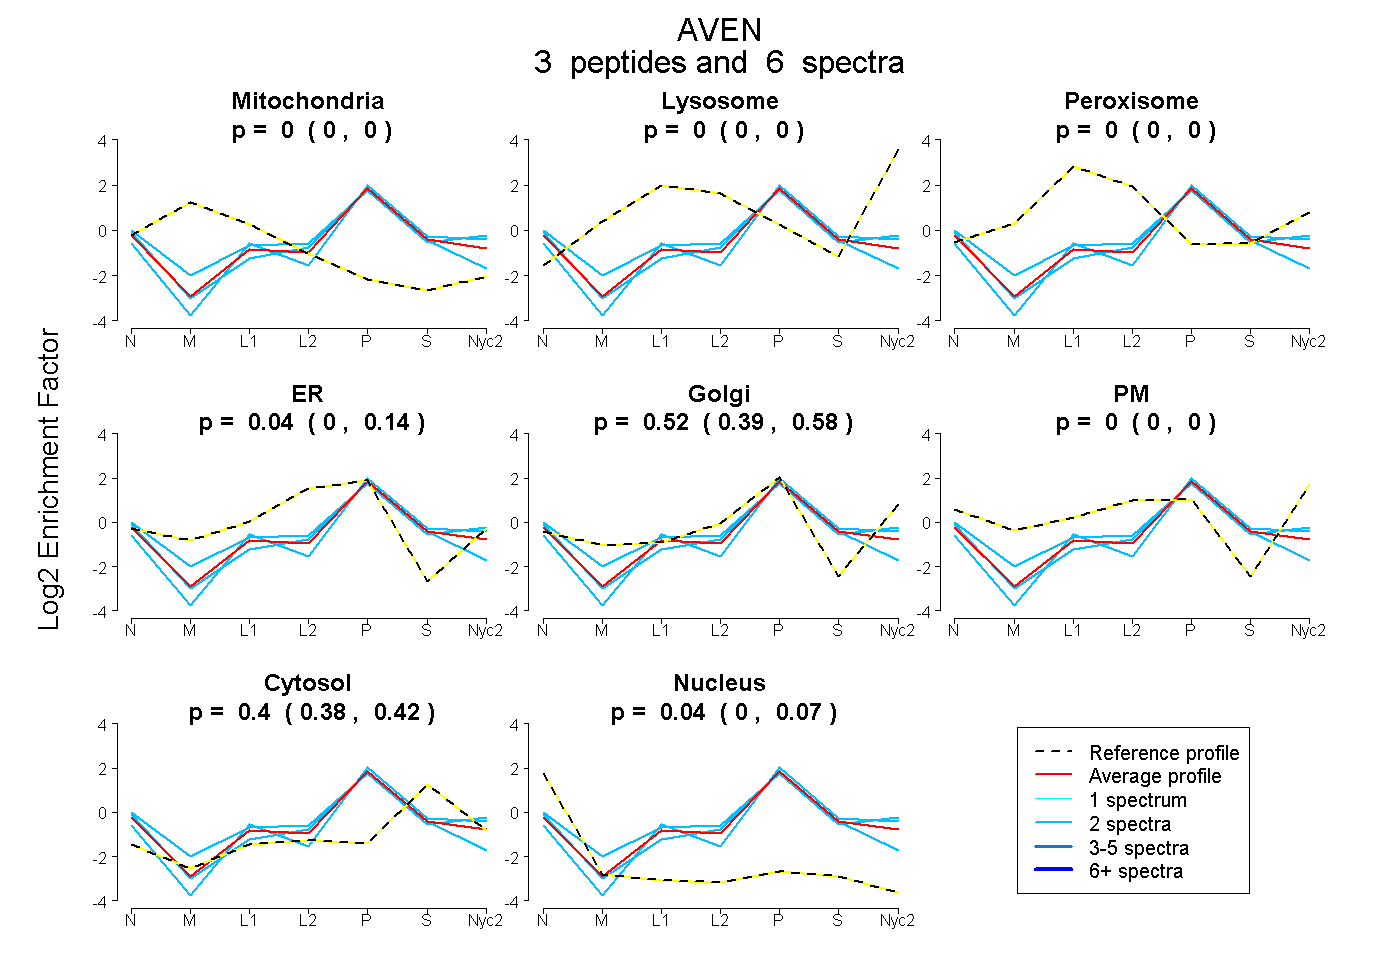
0.000 | 0.000
0.000 | 0.000
0.000 | 0.000
0.000 | 0.138
0.387 | 0.582
0.000 | 0.000
0.380 | 0.423
0.005 | 0.065
| Plot | Mito | Lyso | Perox | ER | Golgi | PM | Cytosol | Nucleus | |||||
| Expt A |
3 peptides |
6 spectra |
|
0.000 0.000 | 0.000 |
0.000 0.000 | 0.000 |
0.000 0.000 | 0.000 |
0.035 0.000 | 0.138 |
0.524 0.387 | 0.582 |
0.000 0.000 | 0.000 |
0.403 0.380 | 0.423 |
0.037 0.005 | 0.065 |
| 2 spectra, QNSALYVDSESLVR | 0.000 | 0.000 | 0.000 | 0.097 | 0.560 | 0.000 | 0.342 | 0.000 | ||
| 2 spectra, ALQQLPLAVR | 0.000 | 0.000 | 0.000 | 0.251 | 0.235 | 0.000 | 0.387 | 0.127 | ||
| 2 spectra, GPLSQLR | 0.000 | 0.000 | 0.000 | 0.000 | 0.519 | 0.000 | 0.481 | 0.000 |
| Plot | Mito | Lyso or Perox | ER | Golgi | PM | Cytosol | Nucleus | ||||||
| Expt B |
1 peptide |
2 spectra |
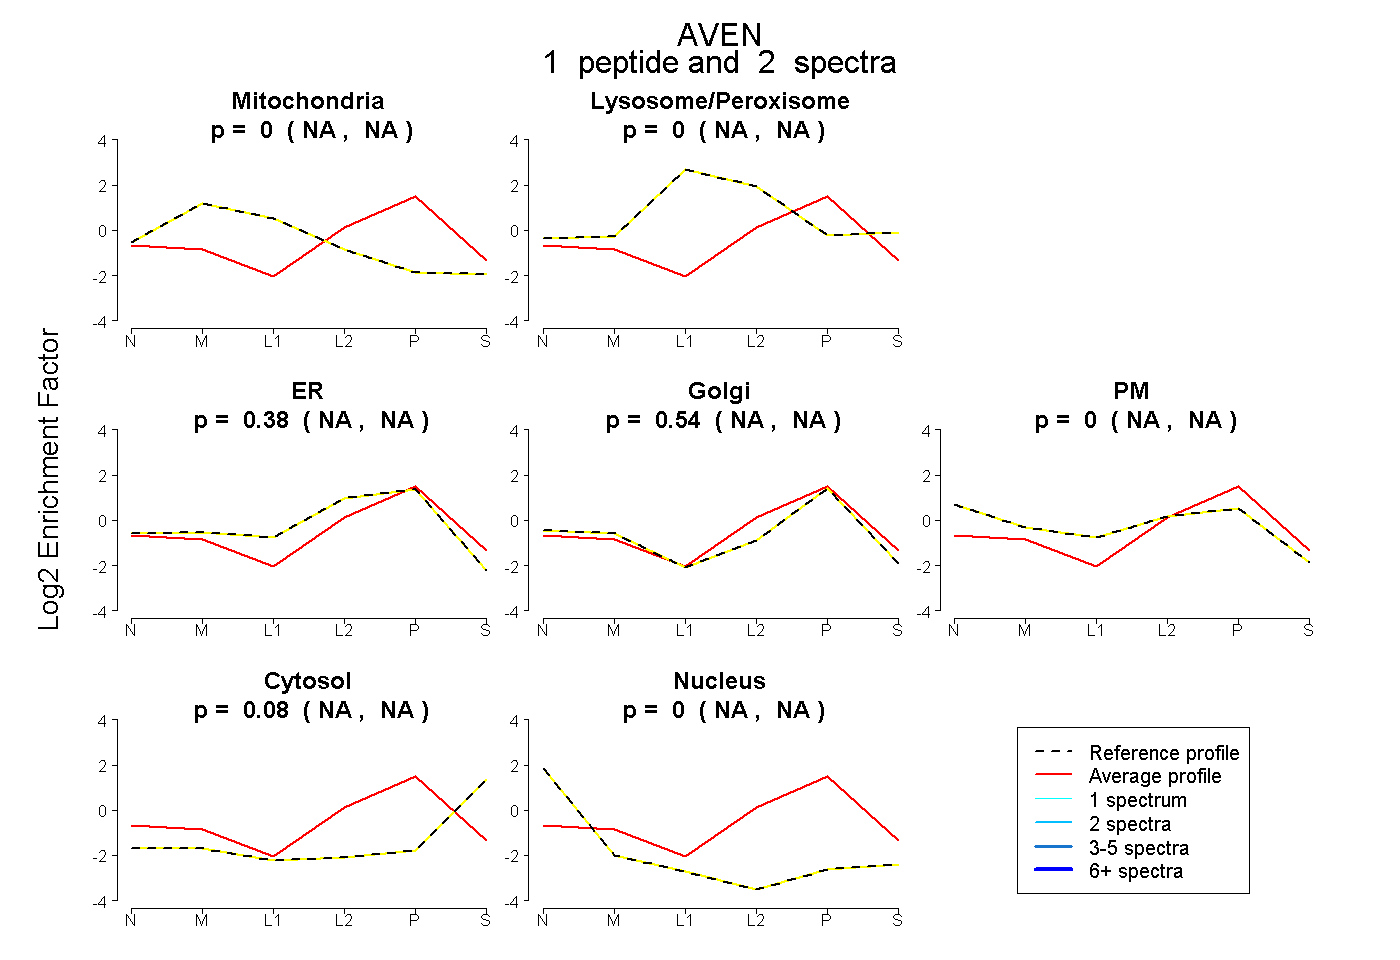 |
0.000 NA | NA |
0.000 NA | NA |
0.380 NA | NA |
0.537 NA | NA |
0.000 NA | NA |
0.083 NA | NA |
0.000 NA | NA |
|||
| Plot | Lyso | Other | |||||||||||
| Expt C |
1 peptide |
2 spectra |
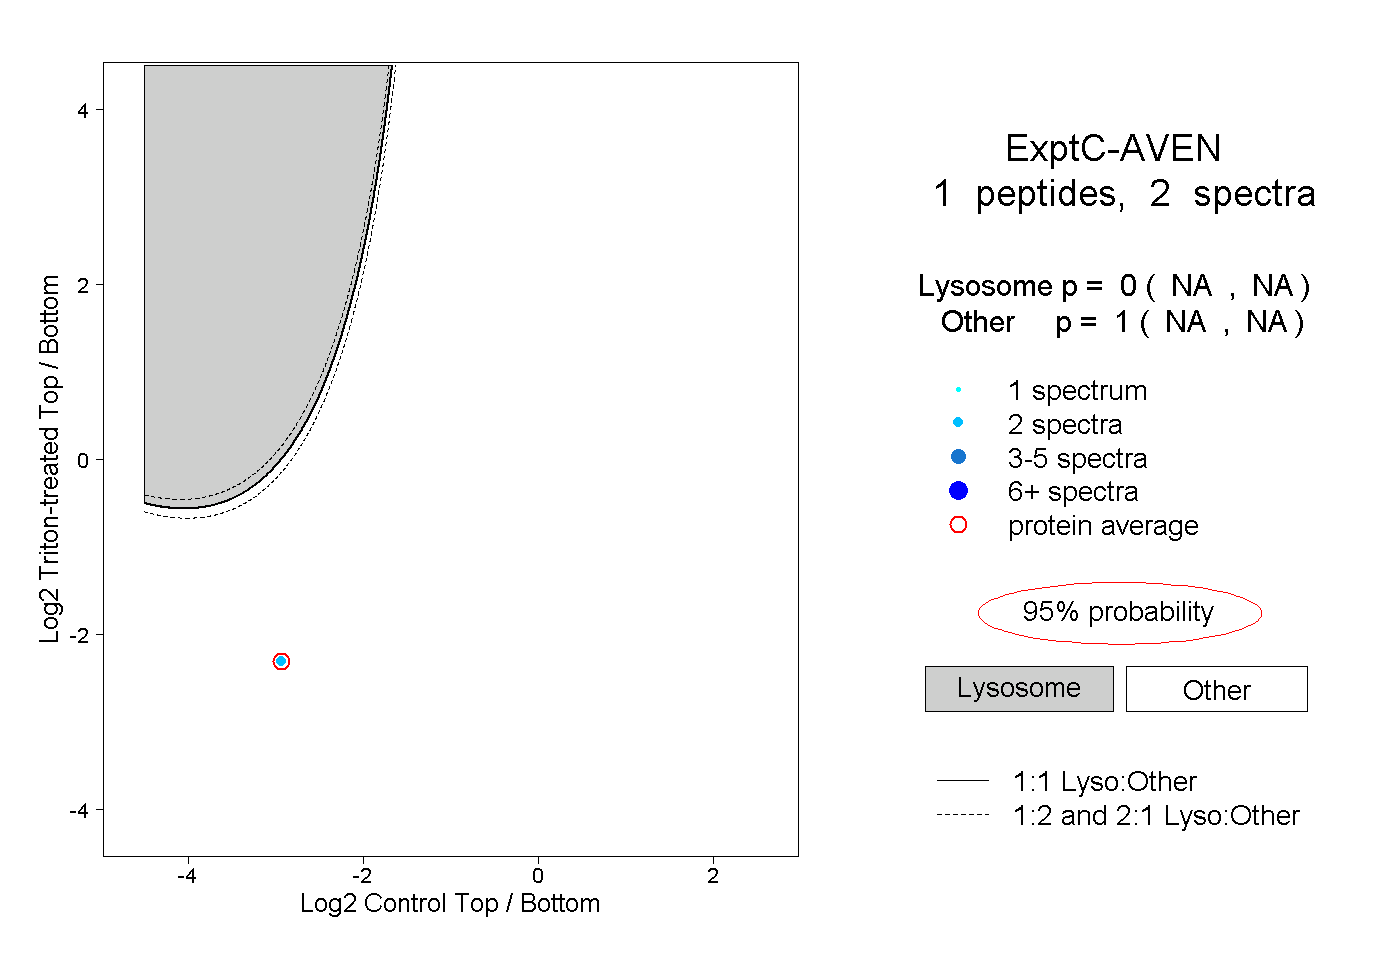 |
0.000 NA | NA |
1.000 NA | NA |