 2
2peptides
spectra
0.074 | 0.254
0.000 | 0.000
0.000 | 0.000
0.668 | 0.827
0.000 | 0.000
0.000 | 0.000
0.000 | 0.000
0.000 | 0.127
| Plot | Mito | Lyso | Perox | ER | Golgi | PM | Cytosol | Nucleus | |||||
| Expt A |
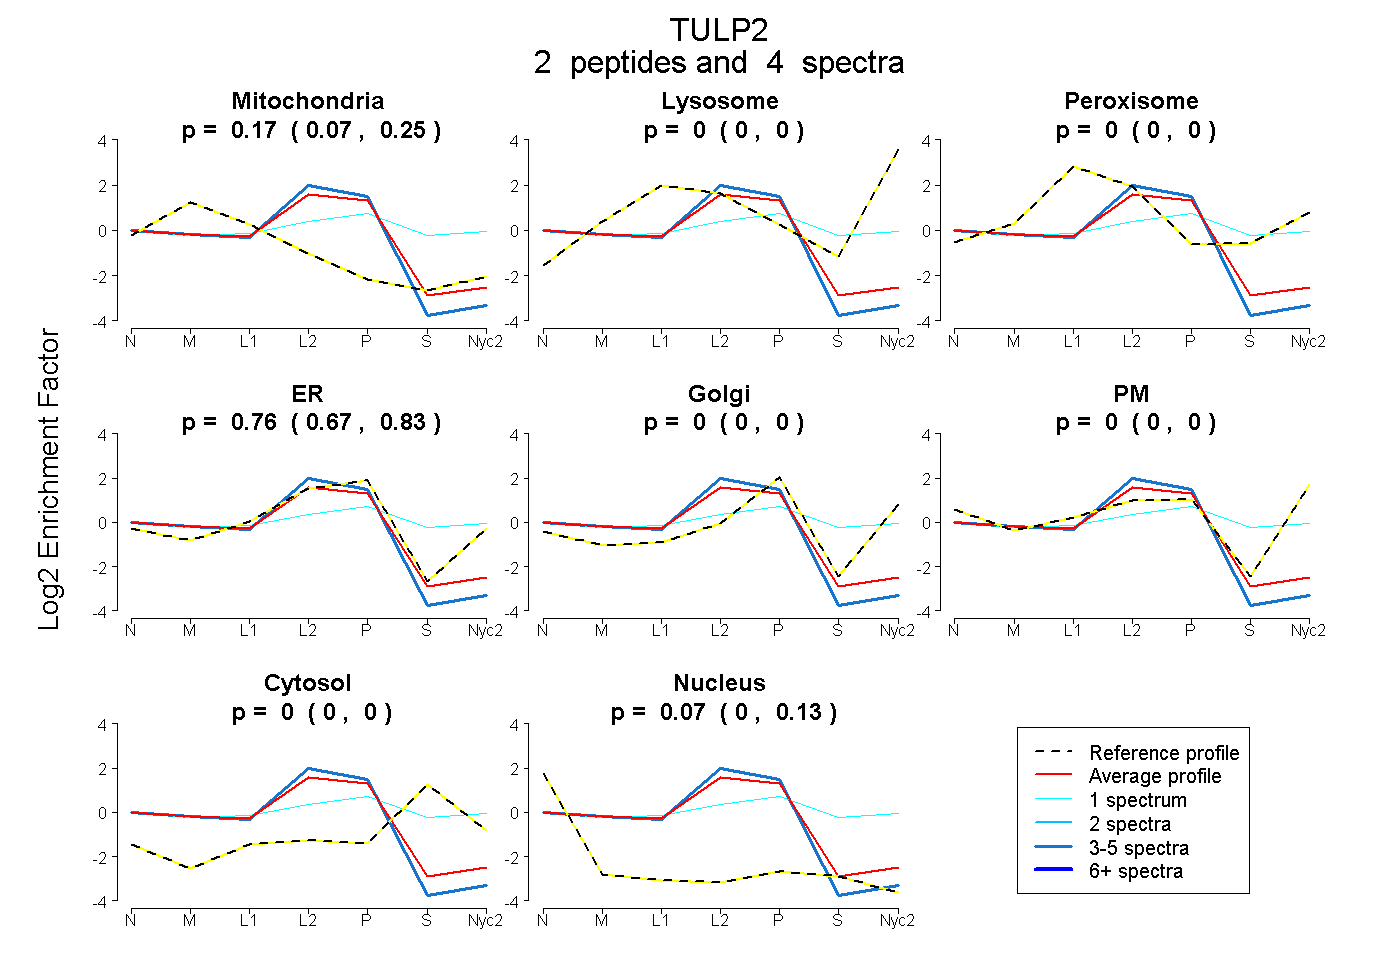
2 peptides |
4 spectra |
|
0.172 0.074 | 0.254 |
0.000 0.000 | 0.000 |
0.000 0.000 | 0.000 |
0.758 0.668 | 0.827 |
0.000 0.000 | 0.000 |
0.000 0.000 | 0.000 |
0.000 0.000 | 0.000 |
0.069 0.000 | 0.127 |
| 1 spectrum, SSPLGHFLLAGR | 0.029 | 0.000 | 0.229 | 0.154 | 0.195 | 0.113 | 0.279 | 0.000 | ||
| 3 spectra, HGLLLLQNK | 0.141 | 0.000 | 0.000 | 0.772 | 0.000 | 0.000 | 0.000 | 0.087 |
| Plot | Mito | Lyso or Perox | ER | Golgi | PM | Cytosol | Nucleus | ||||||
| Expt B |
1 peptide |
2 spectra |
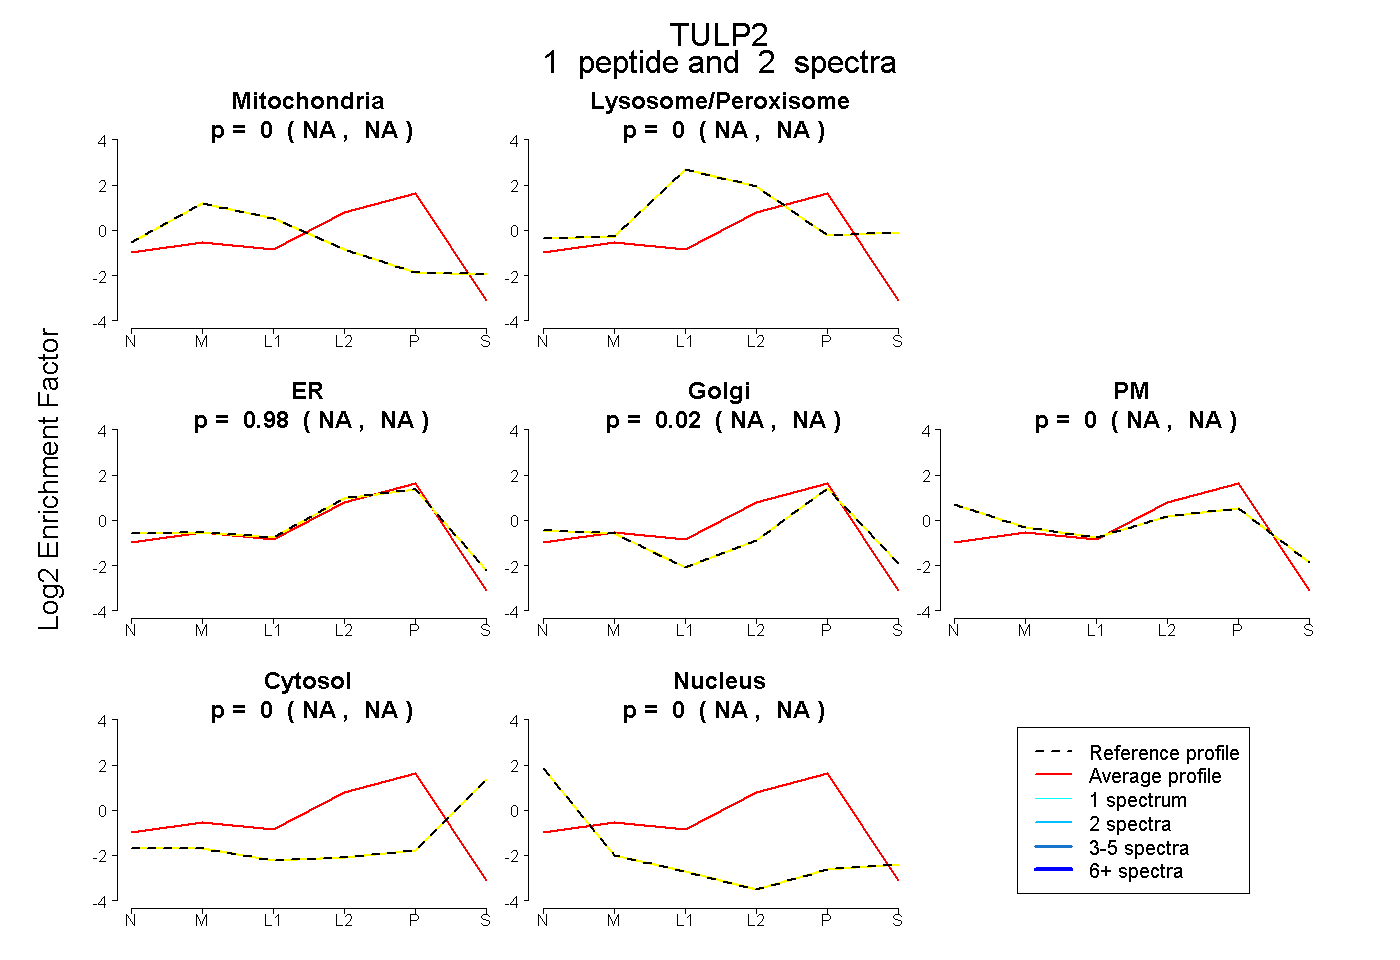 |
0.000 NA | NA |
0.000 NA | NA |
0.976 NA | NA |
0.024 NA | NA |
0.000 NA | NA |
0.000 NA | NA |
0.000 NA | NA |