 9
9peptides
spectra
0.000 | 0.000
0.408 | 0.450
0.000 | 0.000
0.000 | 0.000
0.060 | 0.115
0.254 | 0.330
0.172 | 0.191
0.000 | 0.000
8peptides
spectra
0.000 | 0.034
0.966 | 1.000
| Plot | Mito | Lyso | Perox | ER | Golgi | PM | Cytosol | Nucleus | |||||
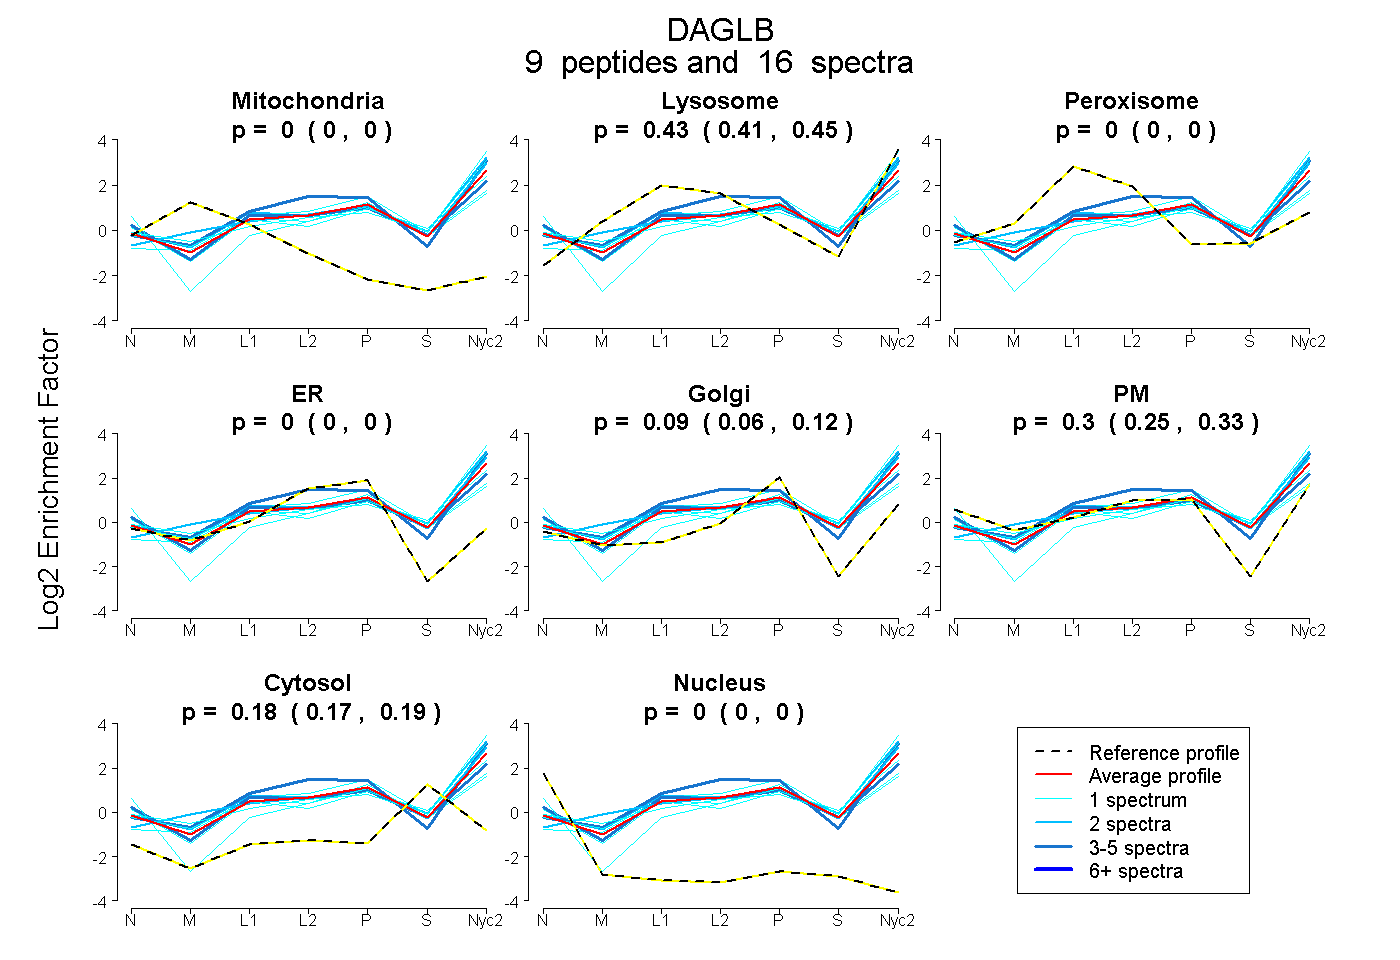
| Expt A |
9 peptides |
16 spectra |
|
0.000 0.000 | 0.000 |
0.431 0.408 | 0.450 |
0.000 0.000 | 0.000 |
0.000 0.000 | 0.000 |
0.090 0.060 | 0.115 |
0.296 0.254 | 0.330 |
0.182 0.172 | 0.191 |
0.000 0.000 | 0.000 |
||
| Plot | Lyso | Other | |||||||||||
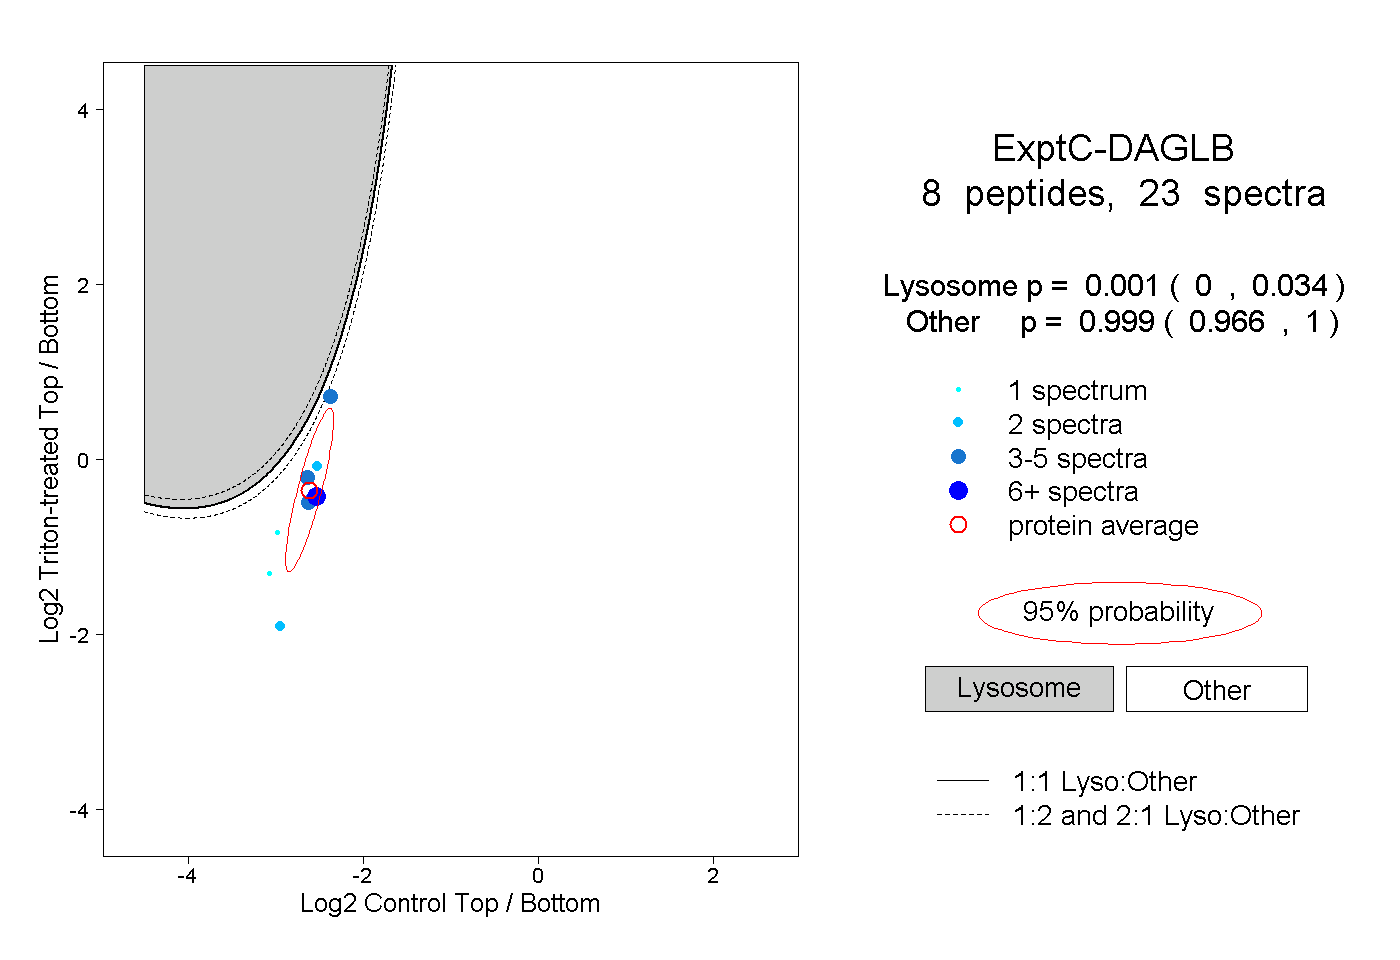
| Expt C |
8 peptides |
23 spectra |
|
0.001 0.000 | 0.034 |
0.999 0.966 | 1.000 |
| 4 spectra, ESVVVAVR | 0.085 | 0.915 | ||||||||
| 2 spectra, VYELPFIVVLDHR | 0.000 | 1.000 | ||||||||
| 2 spectra, SLFEYSK | 0.002 | 0.998 | ||||||||
| 4 spectra, AYAFSPPR | 0.004 | 0.996 | ||||||||
| 6 spectra, VIANCNKPK | 0.000 | 1.000 | ||||||||
| 3 spectra, GAYPQVR | 0.000 | 1.000 | ||||||||
| 1 spectrum, IIHLEEEGGSGR | 0.000 | 1.000 | ||||||||
| 1 spectrum, ILIGPK | 0.001 | 0.999 |
| Plot | Lyso | Other | |||||||||||
| Expt D |
2 peptides |
4 spectra |
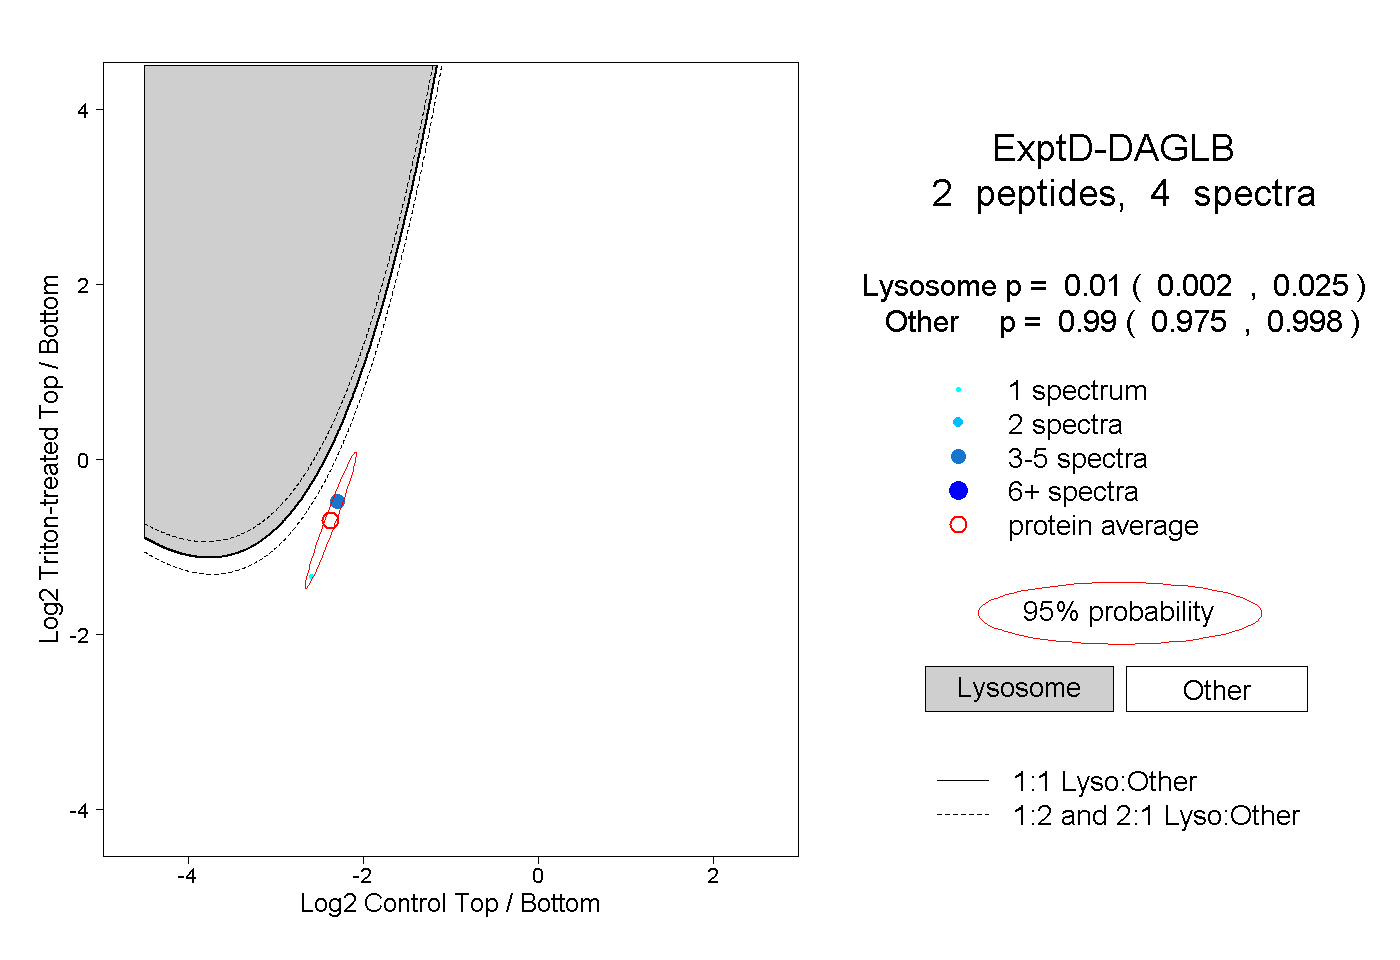 |
0.010 0.002 | 0.025 |
0.990 0.975 | 0.998 |