 5
5peptides
spectra
0.000 | 0.000
0.107 | 0.148
0.000 | 0.012
0.000 | 0.003
0.031 | 0.089
0.061 | 0.139
0.692 | 0.709
0.000 | 0.000
6peptides
spectra
0.000 | 0.000
1.000 | 1.000
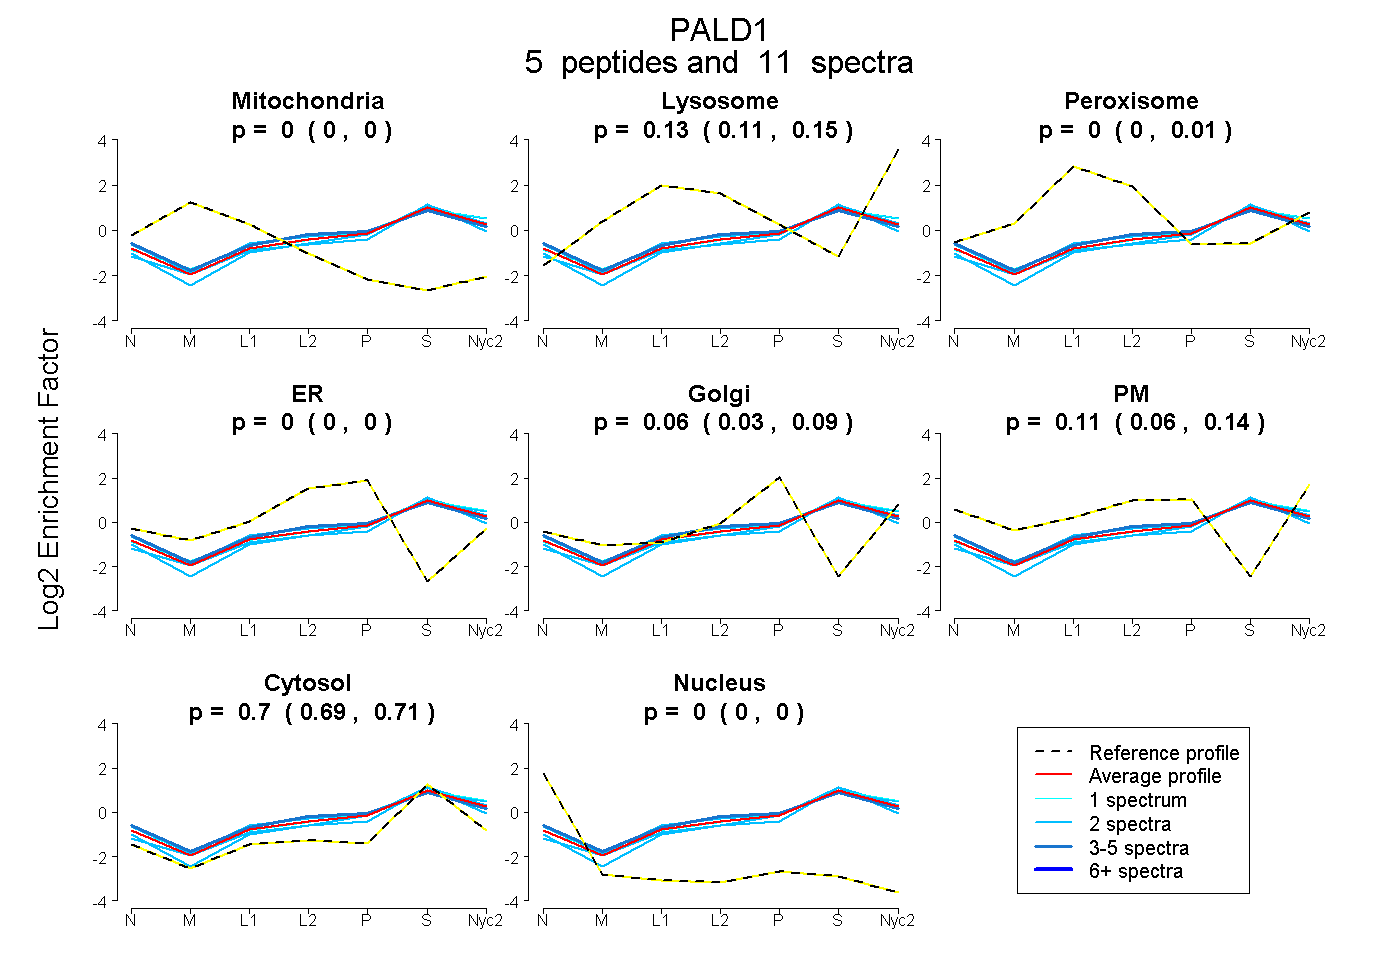
| Plot | Mito | Lyso | Perox | ER | Golgi | PM | Cytosol | Nucleus | |||||
| Expt A |
5 peptides |
11 spectra |
|
0.000 0.000 | 0.000 |
0.131 0.107 | 0.148 |
0.000 0.000 | 0.012 |
0.000 0.000 | 0.003 |
0.061 0.031 | 0.089 |
0.106 0.061 | 0.139 |
0.702 0.692 | 0.709 |
0.000 0.000 | 0.000 |
||
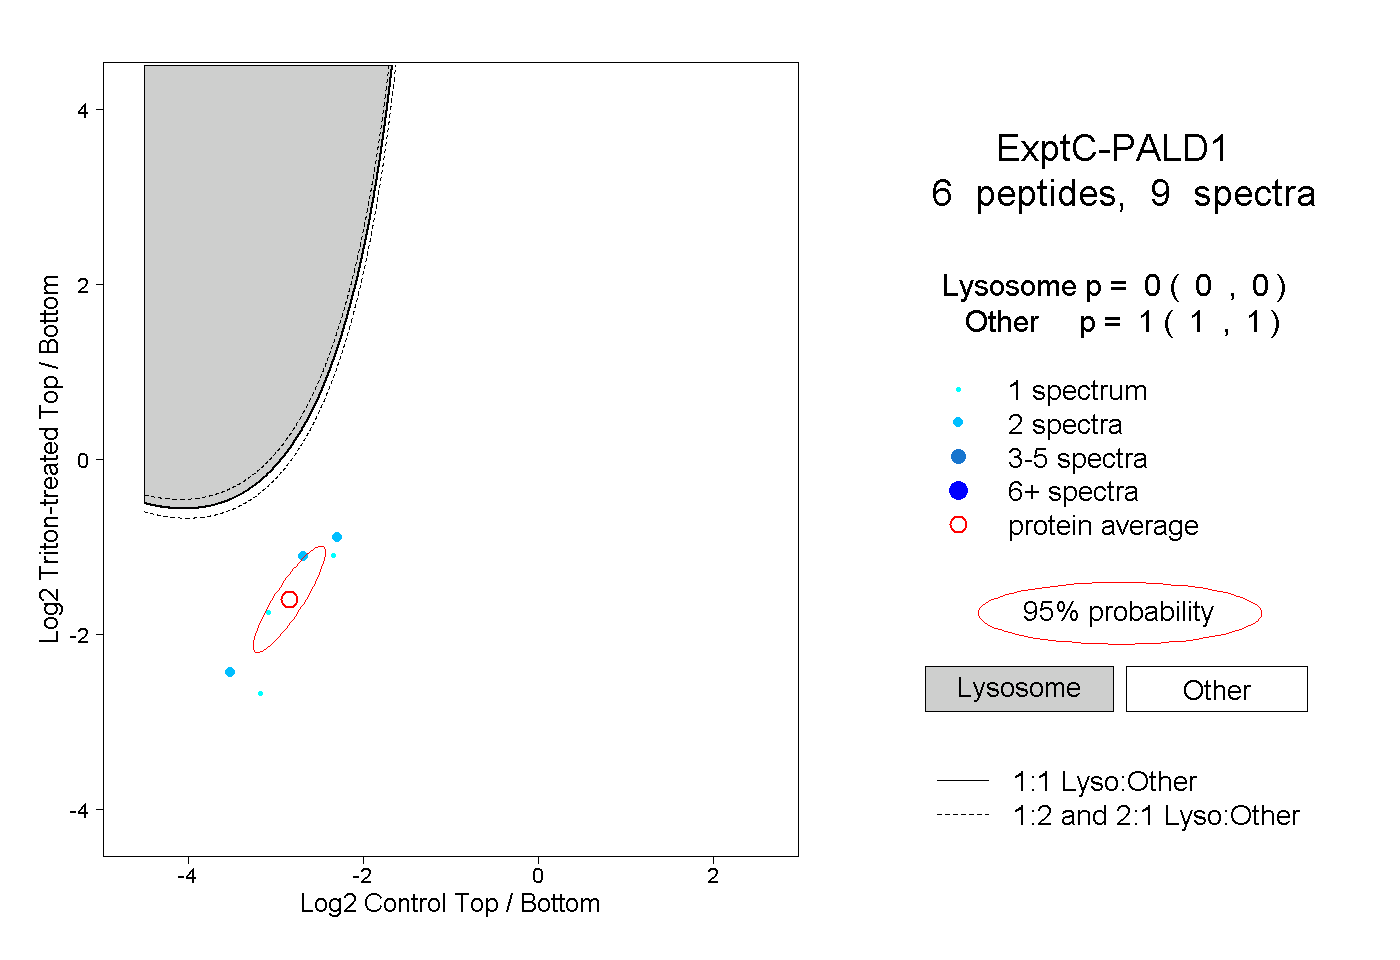
| Plot | Lyso | Other | |||||||||||
| Expt C |
6 peptides |
9 spectra |
|
0.000 0.000 | 0.000 |
1.000 1.000 | 1.000 |
| 2 spectra, RPLFLQPTYR | 0.000 | 1.000 | ||||||||
| 1 spectrum, LEQECGSQHSVQQR | 0.000 | 1.000 | ||||||||
| 1 spectrum, ETPSLLQLR | 0.000 | 1.000 | ||||||||
| 2 spectra, EVIISTYR | 0.000 | 1.000 | ||||||||
| 2 spectra, EEPVLFLR | 0.000 | 1.000 | ||||||||
| 1 spectrum, EIHDFAQLR | 0.000 | 1.000 |