12
12peptides
spectra
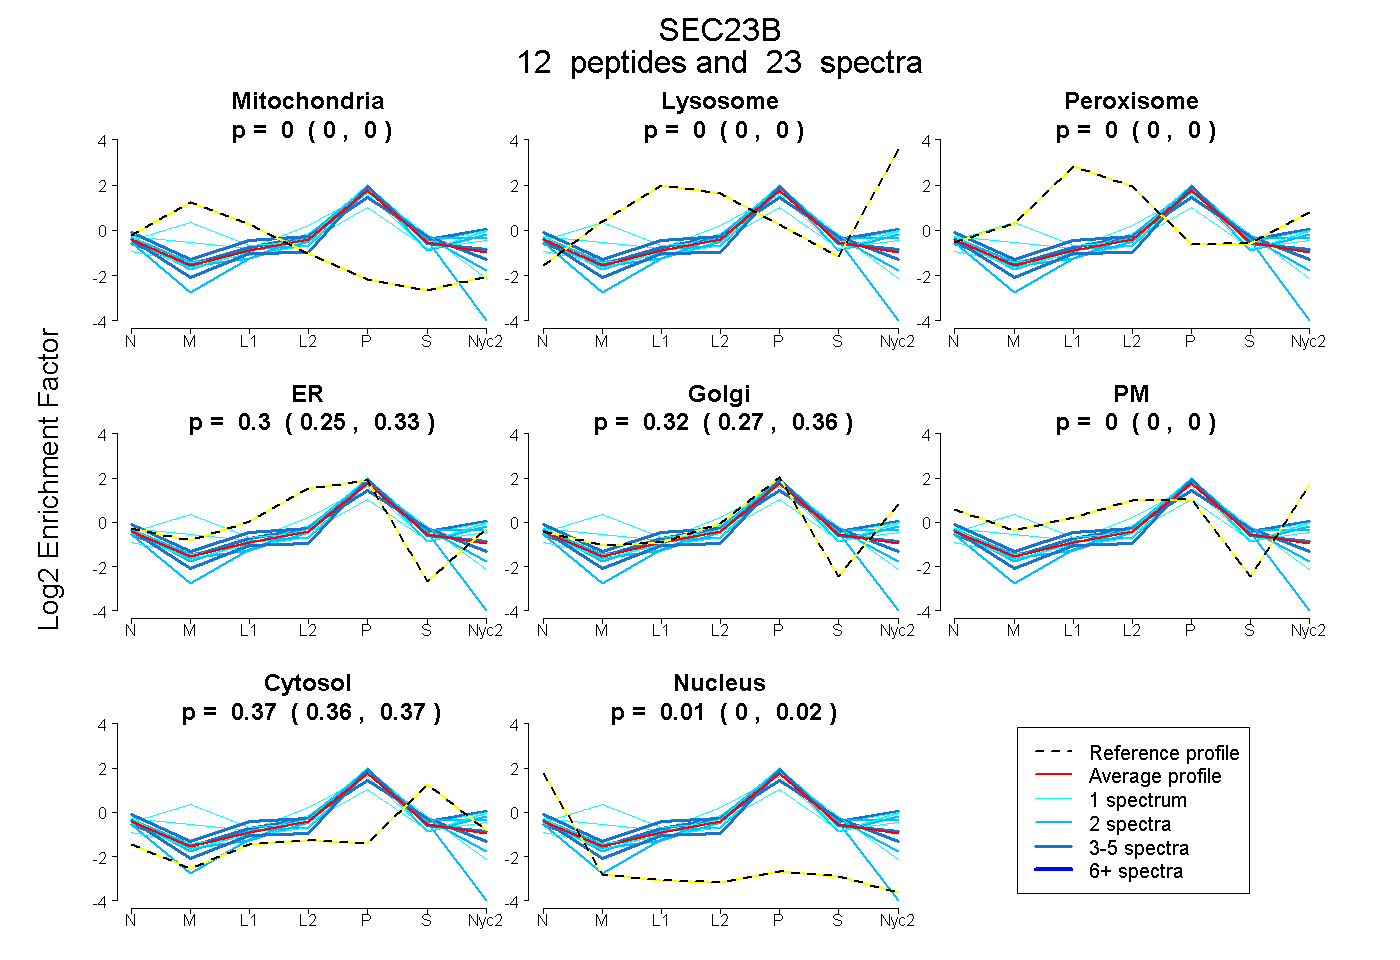
0.000 | 0.000
0.000 | 0.000
0.000 | 0.000
0.254 | 0.327
0.273 | 0.362
0.000 | 0.000
0.362 | 0.373
0.002 | 0.024
3peptides
spectra
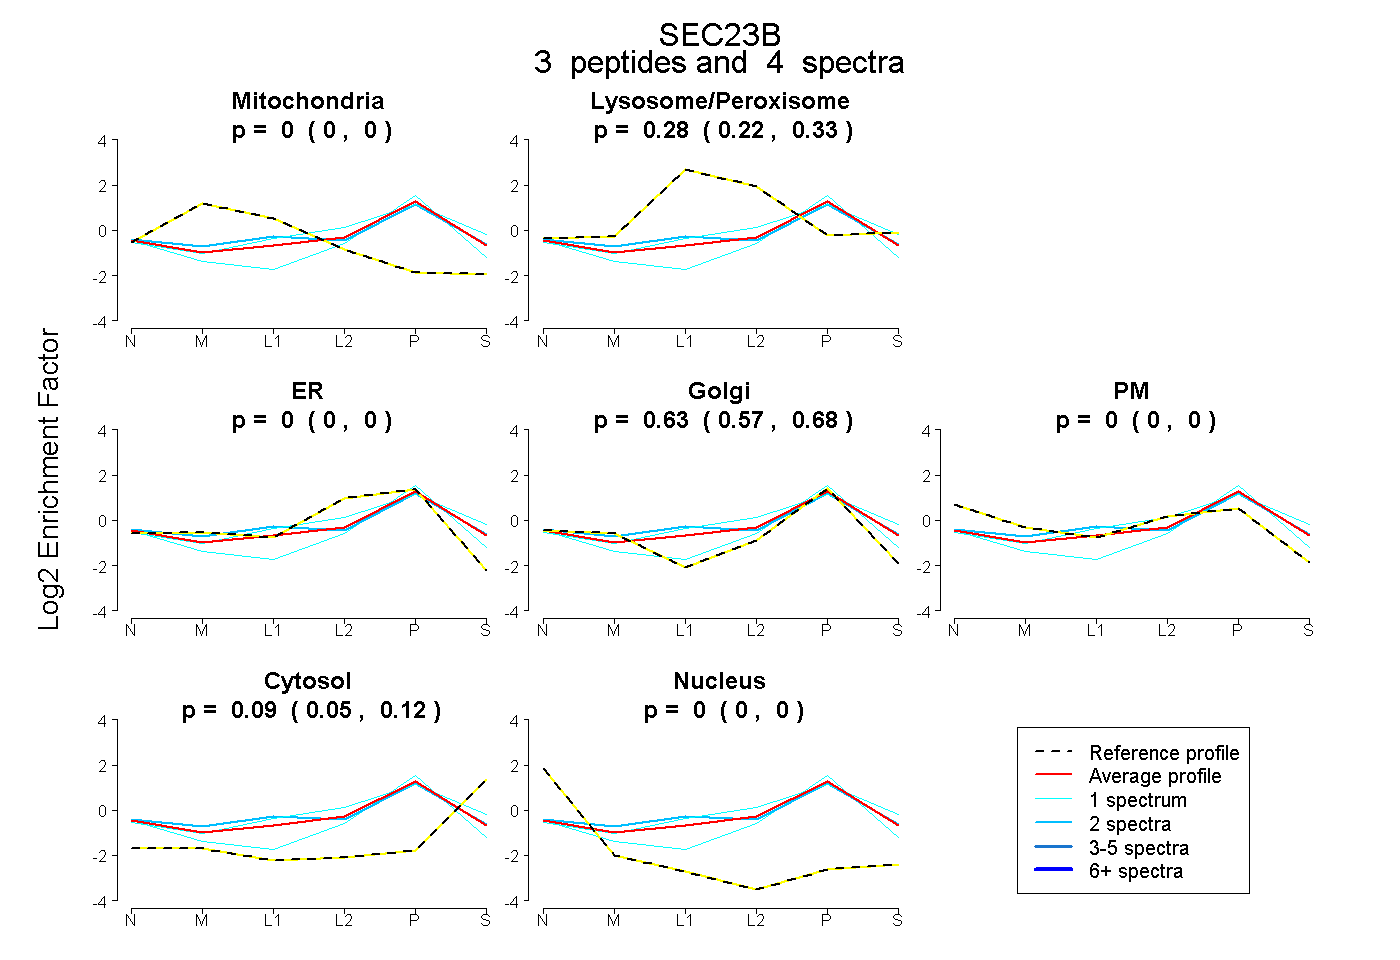
0.000 | 0.000
0.215 | 0.332
0.000 | 0.000
0.574 | 0.679
0.000 | 0.000
0.050 | 0.122
0.000 | 0.000
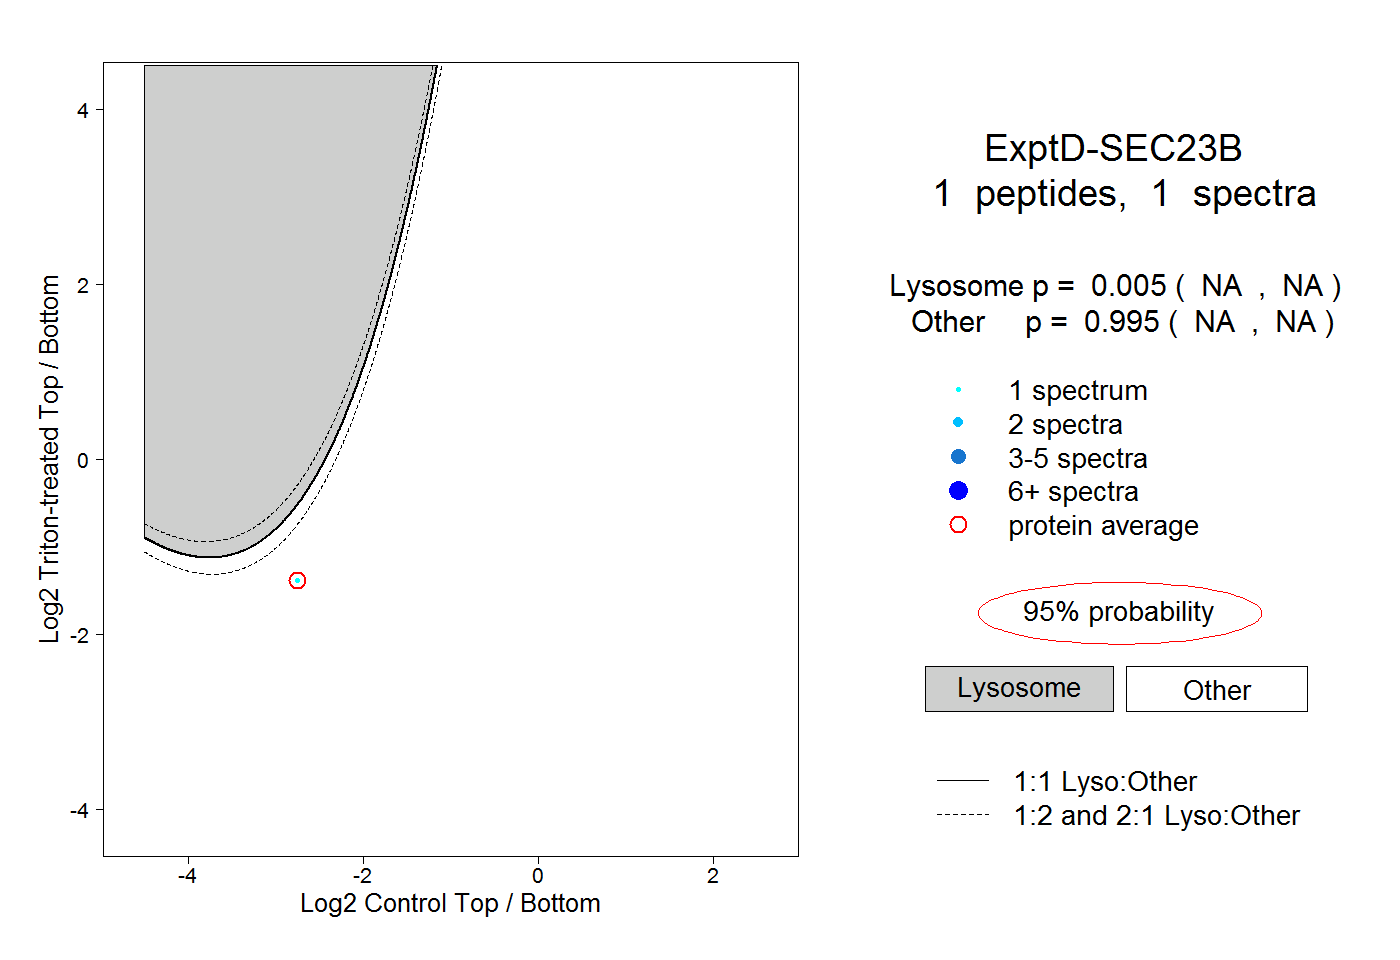
9peptides
spectra
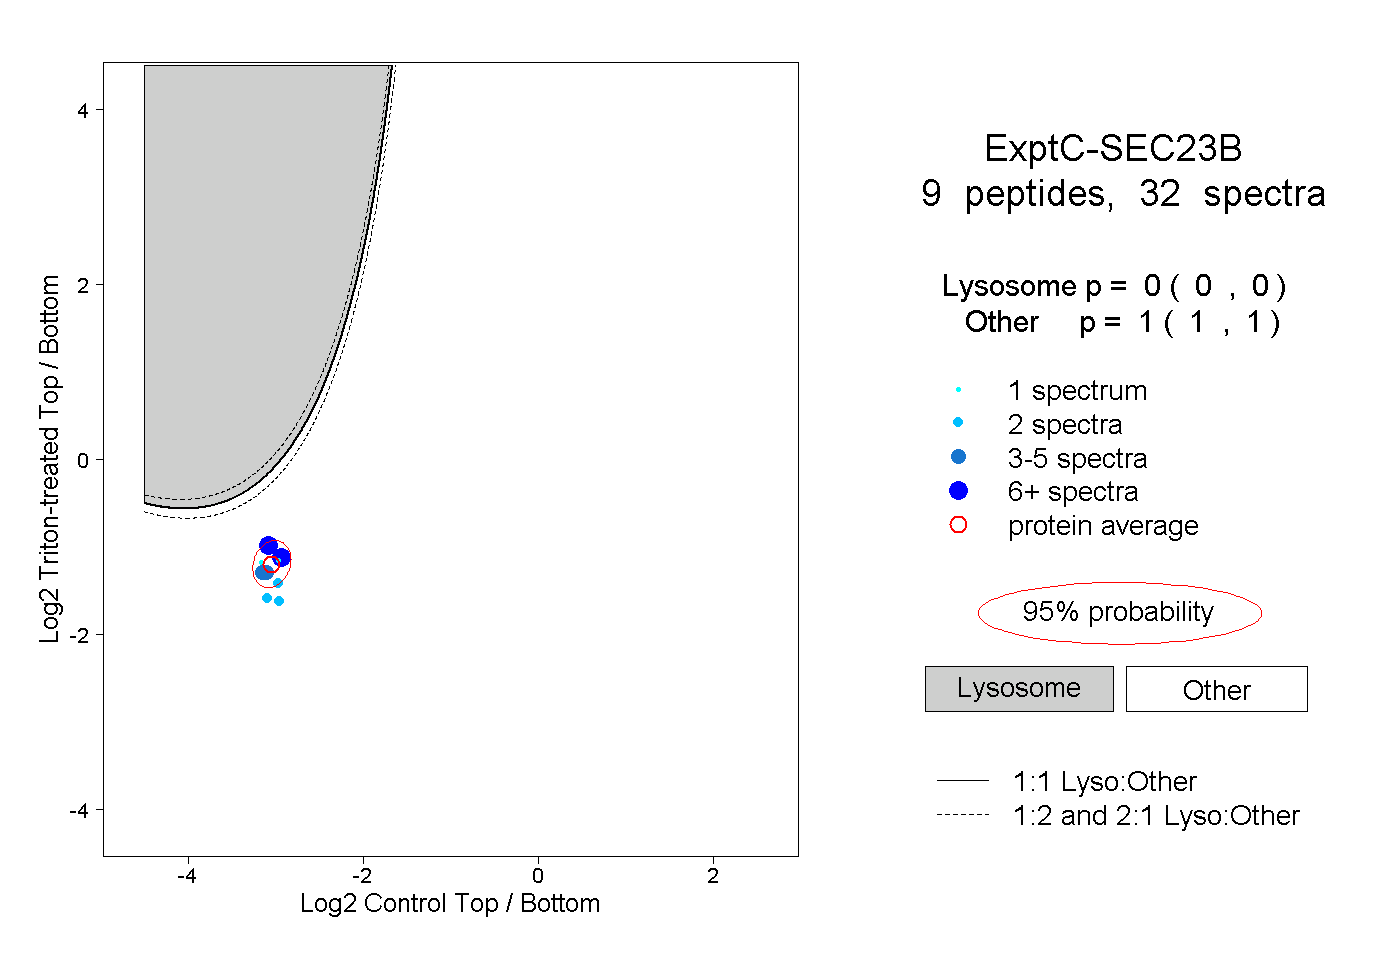
0.000 | 0.000
1.000 | 1.000