 12
12peptides
spectra
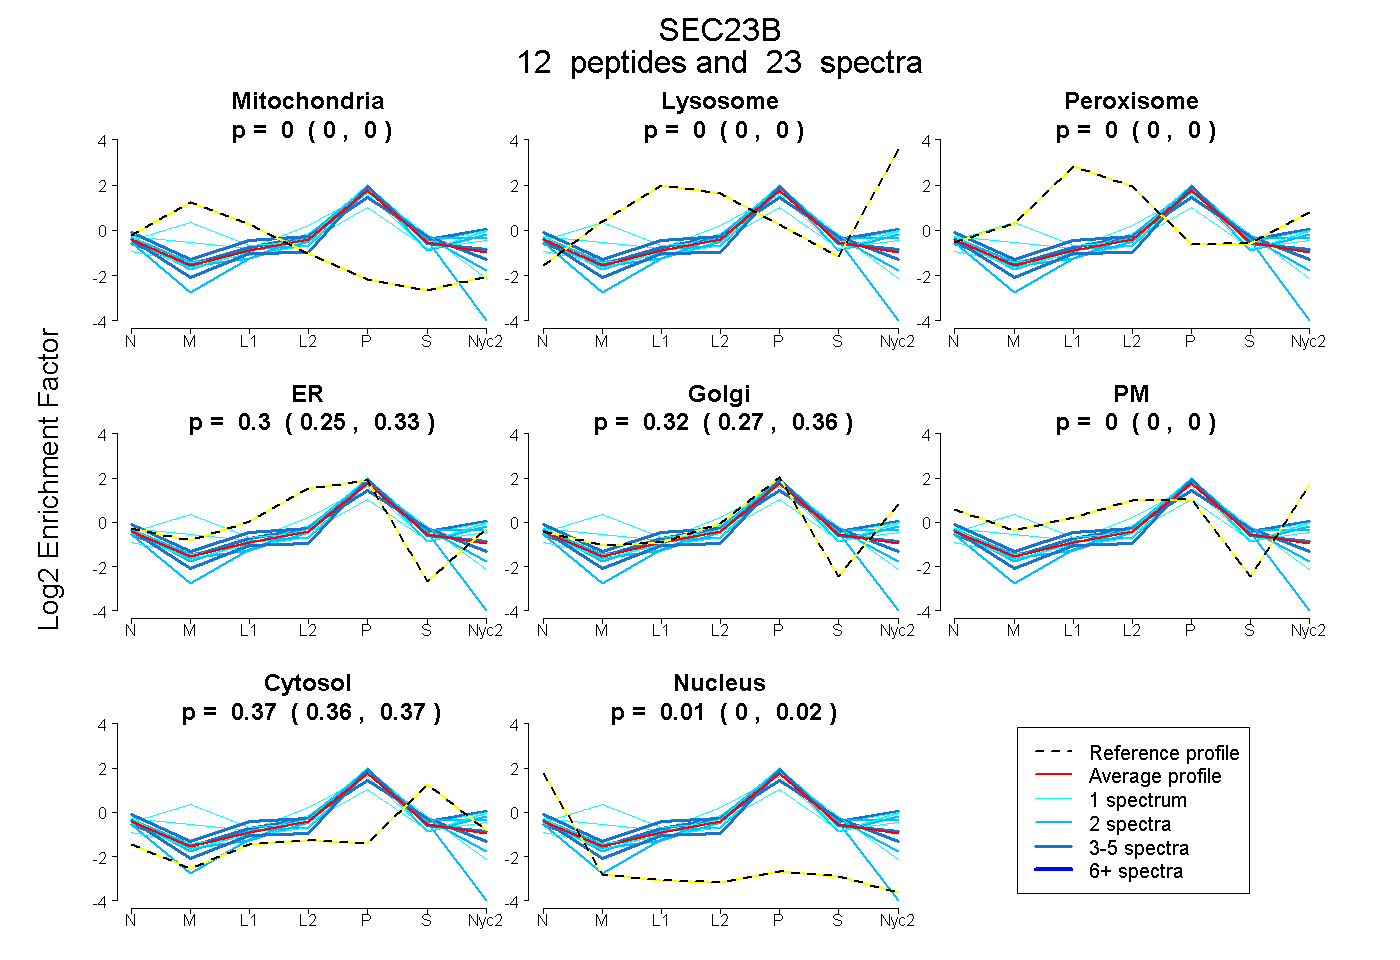
0.000 | 0.000
0.000 | 0.000
0.000 | 0.000
0.254 | 0.327
0.273 | 0.362
0.000 | 0.000
0.362 | 0.373
0.002 | 0.024
| Plot | Mito | Lyso | Perox | ER | Golgi | PM | Cytosol | Nucleus | |||||
| Expt A |
12 peptides |
23 spectra |
|
0.000 0.000 | 0.000 |
0.000 0.000 | 0.000 |
0.000 0.000 | 0.000 |
0.296 0.254 | 0.327 |
0.321 0.273 | 0.362 |
0.000 0.000 | 0.000 |
0.368 0.362 | 0.373 |
0.014 0.002 | 0.024 |
| 2 spectra, LWACNFCFQR | 0.000 | 0.000 | 0.000 | 0.475 | 0.000 | 0.000 | 0.288 | 0.237 | ||
| 3 spectra, MVQVHELSCEGISK | 0.000 | 0.000 | 0.000 | 0.550 | 0.013 | 0.000 | 0.411 | 0.026 | ||
| 1 spectrum, FLQPVHK | 0.000 | 0.000 | 0.000 | 0.123 | 0.565 | 0.000 | 0.312 | 0.000 | ||
| 1 spectrum, HYEMLANR | 0.221 | 0.000 | 0.075 | 0.000 | 0.529 | 0.000 | 0.175 | 0.000 | ||
| 2 spectra, DFNGDFR | 0.000 | 0.000 | 0.000 | 0.161 | 0.576 | 0.000 | 0.263 | 0.000 | ||
| 3 spectra, DPWPVTQGK | 0.000 | 0.000 | 0.000 | 0.114 | 0.560 | 0.000 | 0.326 | 0.000 | ||
| 2 spectra, AILNPLCQVDYR | 0.000 | 0.000 | 0.000 | 0.416 | 0.104 | 0.000 | 0.400 | 0.080 | ||
| 1 spectrum, ATYLEFIQQNEER | 0.000 | 0.000 | 0.057 | 0.248 | 0.481 | 0.000 | 0.214 | 0.000 | ||
| 4 spectra, SAMPVQQVRPGQPQEQSAVSSR | 0.000 | 0.000 | 0.000 | 0.036 | 0.573 | 0.000 | 0.351 | 0.040 | ||
| 1 spectrum, MVVPLACLLTPLK | 0.000 | 0.000 | 0.000 | 0.450 | 0.041 | 0.000 | 0.454 | 0.056 | ||
| 1 spectrum, QIQEMLGLTK | 0.000 | 0.000 | 0.000 | 0.079 | 0.655 | 0.000 | 0.266 | 0.000 | ||
| 2 spectra, MAFGATLEVK | 0.000 | 0.000 | 0.000 | 0.071 | 0.537 | 0.000 | 0.392 | 0.000 |
| Plot | Mito | Lyso or Perox | ER | Golgi | PM | Cytosol | Nucleus | ||||||
| Expt B |
3 peptides |
4 spectra |
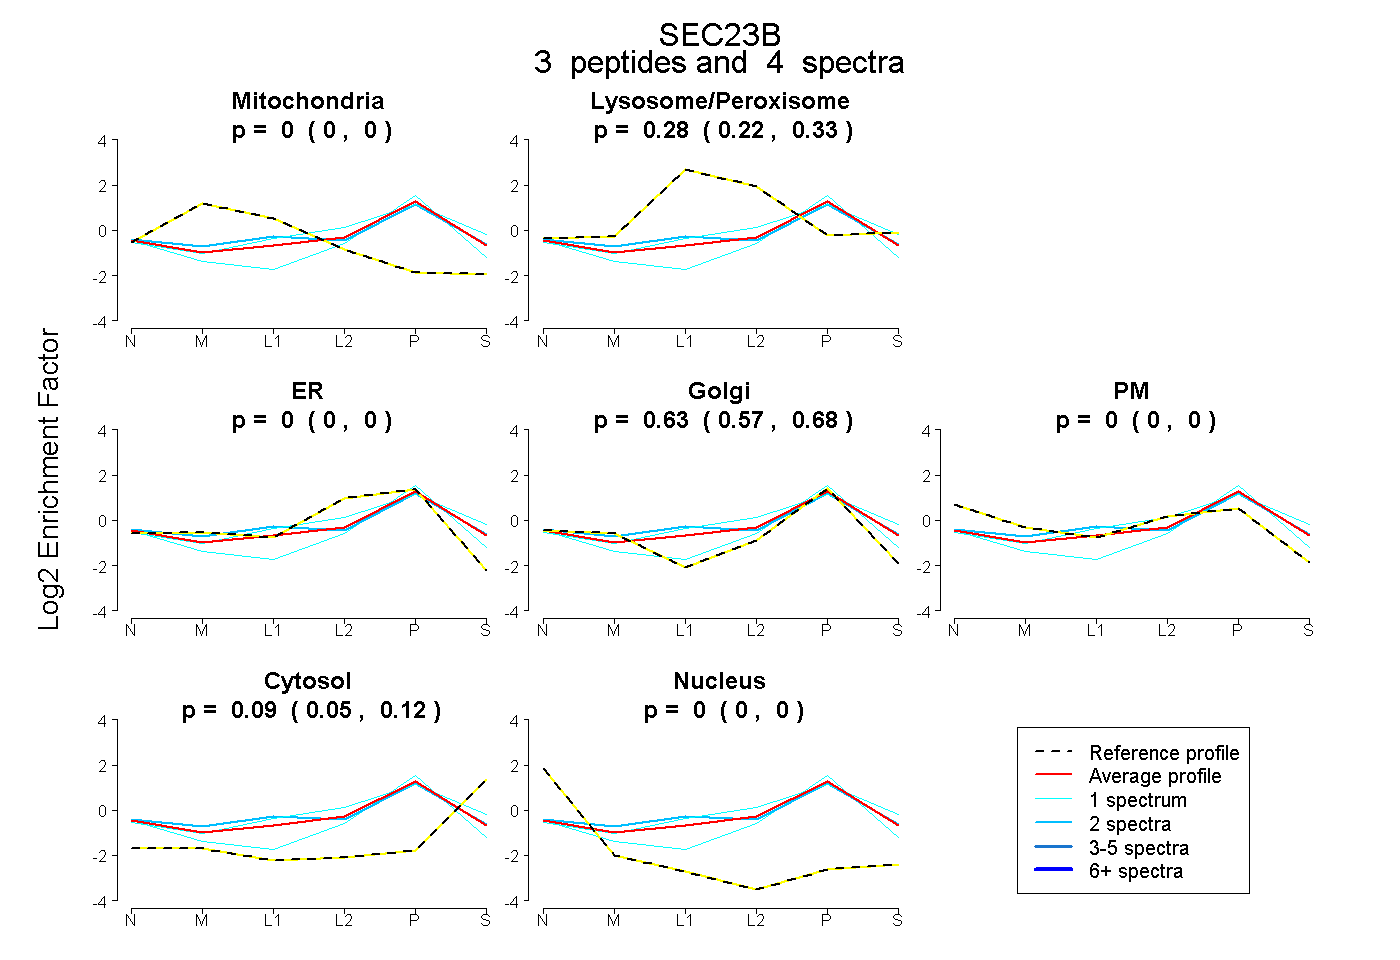 |
0.000 0.000 | 0.000 |
0.279 0.215 | 0.332 |
0.000 0.000 | 0.000 |
0.632 0.574 | 0.679 |
0.000 0.000 | 0.000 |
0.088 0.050 | 0.122 |
0.000 0.000 | 0.000 |
|||
| Plot | Lyso | Other | |||||||||||
| Expt C |
9 peptides |
32 spectra |
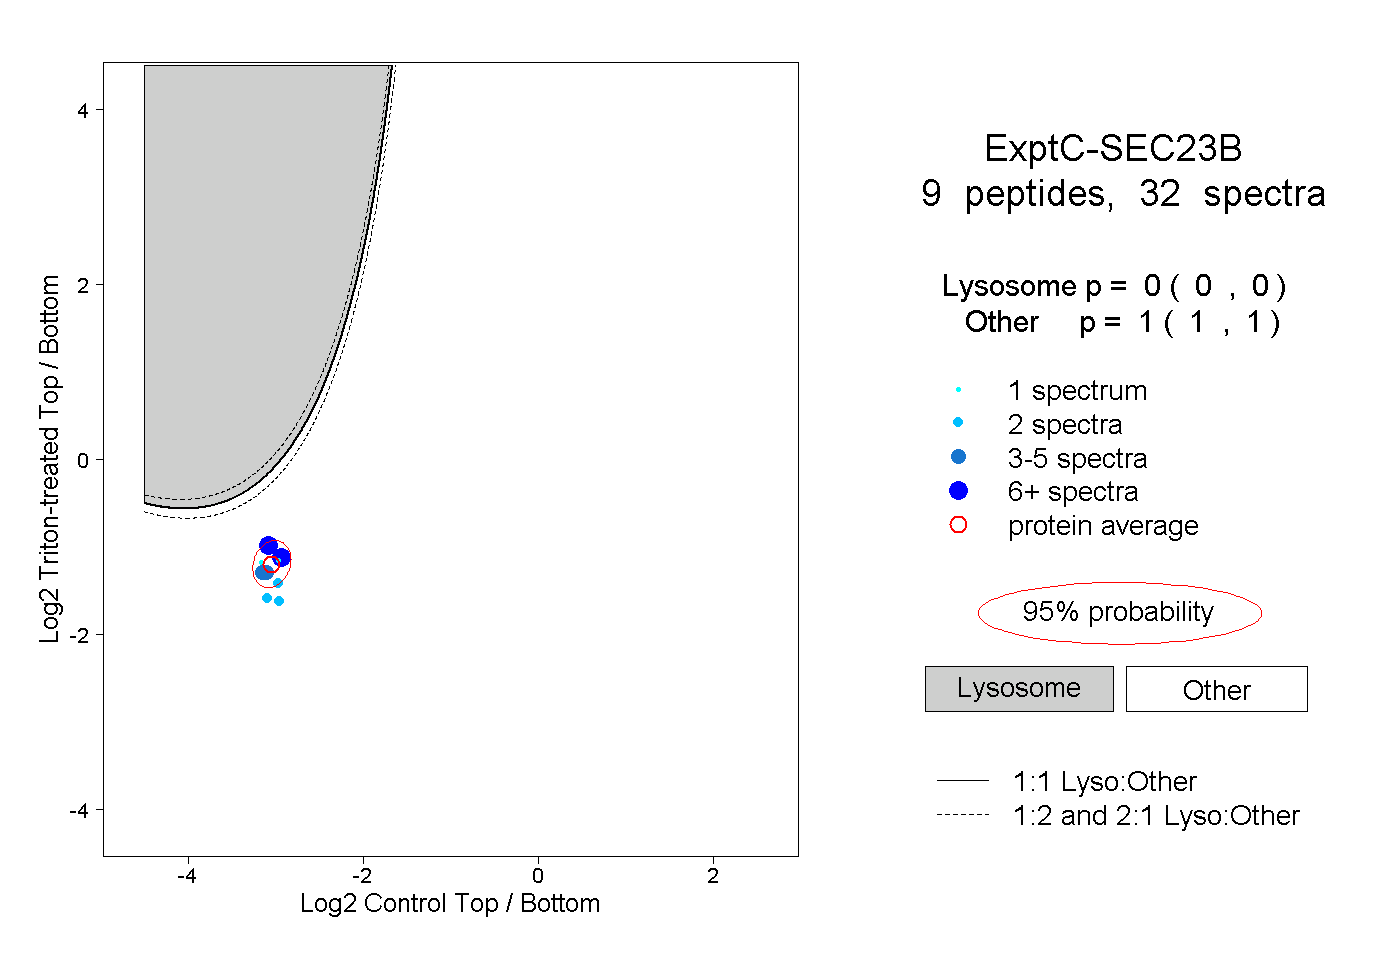 |
0.000 0.000 | 0.000 |
1.000 1.000 | 1.000 |
||||||||
| Plot | Lyso | Other | |||||||||||
| Expt D |
1 peptide |
1 spectrum |
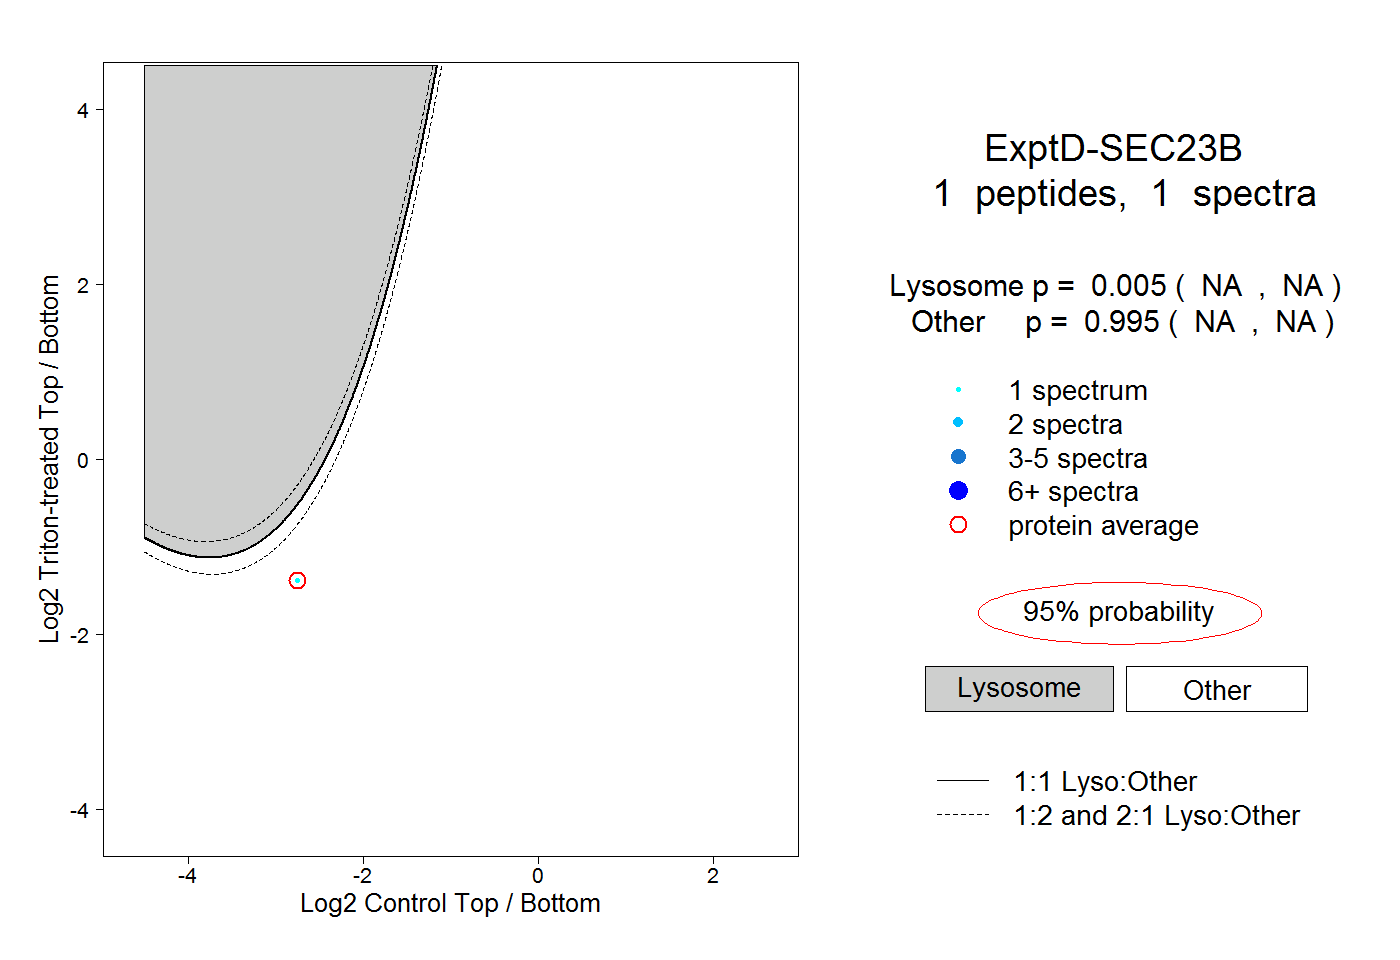 |
0.005 NA | NA |
0.995 NA | NA |