TJP2
[ENSRNOP00000062549]
Main page
| | | Plot |
Mito |
Lyso |
|
Perox |
ER |
Golgi |
PM |
Cytosol |
Nucleus |
|
| Expt A |
 33
33
peptides |
91
spectra |
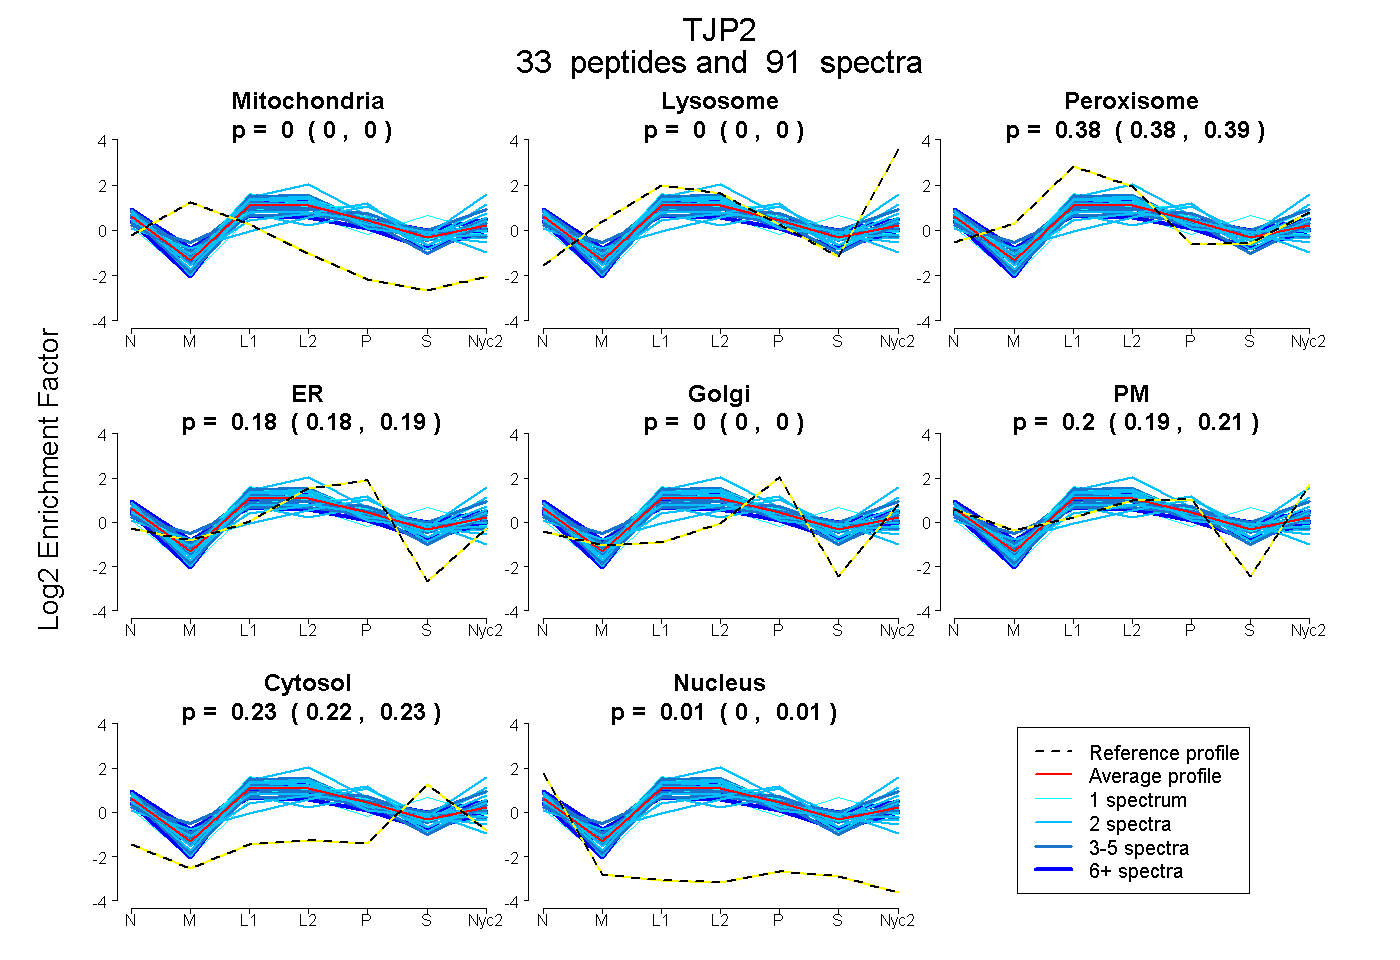 |
0.000
0.000 | 0.000 |
0.000
0.000 | 0.000 |
|
0.382
0.378 | 0.385 |
0.184
0.178 | 0.189 |
0.000
0.000 | 0.000 |
0.201
0.194 | 0.207 |
0.226
0.224 | 0.229 |
0.006
0.004 | 0.008 |
|
| | | Plot |
Mito |
|
Lyso or Perox |
|
ER |
Golgi |
PM |
Cytosol |
Nucleus |
|
| Expt B |
13
peptides |
26
spectra |
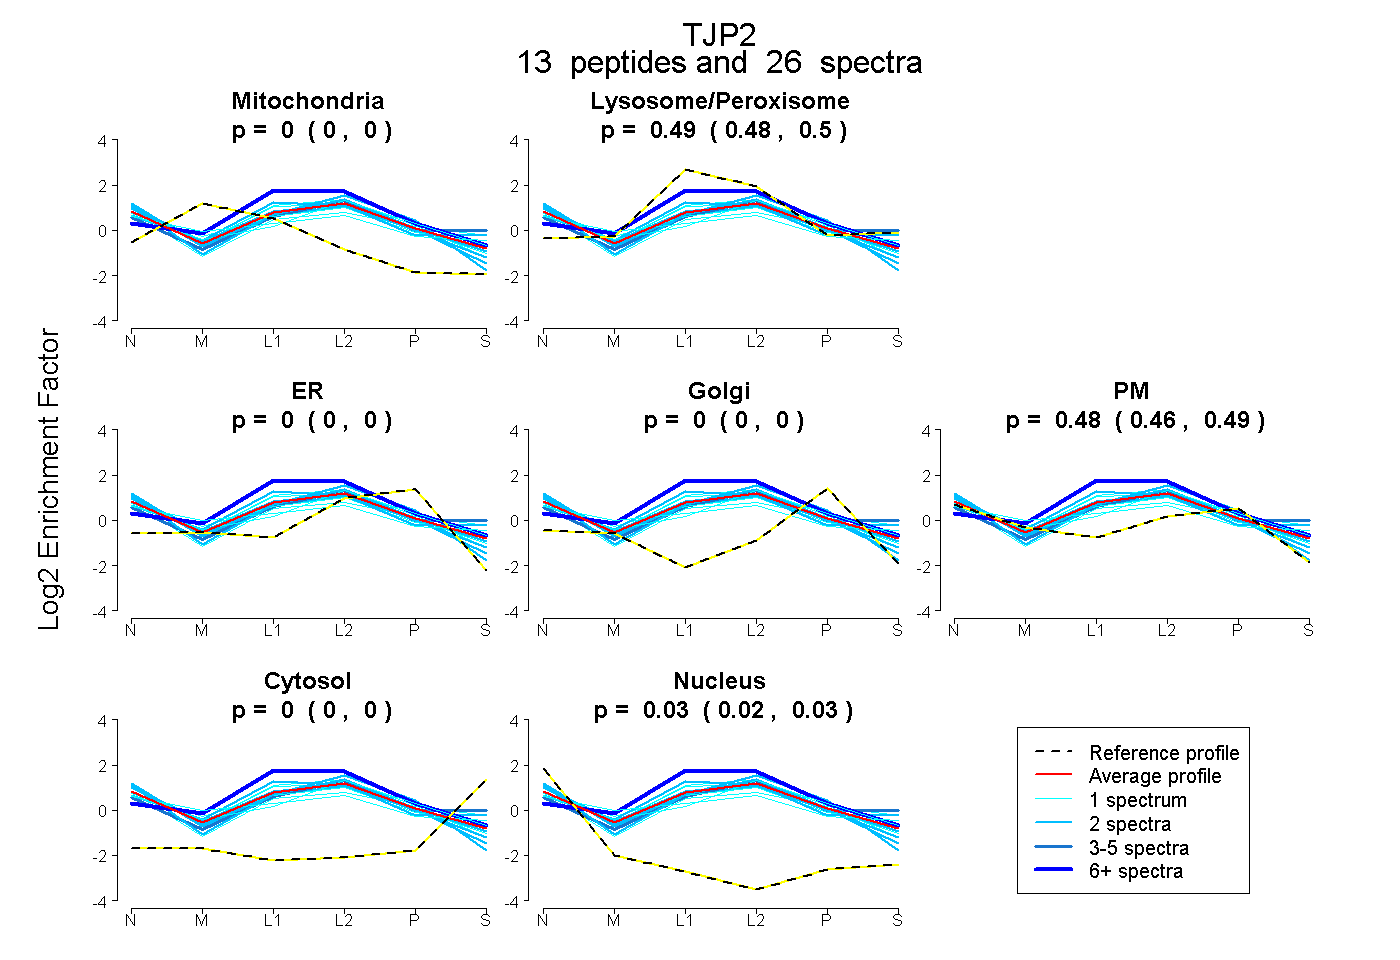 |
0.000
0.000 | 0.000 |
|
0.492
0.481 | 0.501 |
|
0.000
0.000 | 0.000 |
0.000
0.000 | 0.000 |
0.478
0.464 | 0.490 |
0.000
0.000 | 0.000 |
0.030
0.024 | 0.035 |
|
| 1 spectrum, DILACGR |
0.000 |
|
0.511 |
|
0.000 |
0.000 |
0.445 |
0.000 |
0.043 |
|
| 1 spectrum, DGNLHEGDIILK |
0.000 |
|
0.489 |
|
0.000 |
0.000 |
0.511 |
0.000 |
0.000 |
|
| 2 spectra, ANEEYGLR |
0.000 |
|
0.402 |
|
0.000 |
0.000 |
0.545 |
0.000 |
0.053 |
|
| 3 spectra, EDAVLYLLEIPK |
0.000 |
|
0.527 |
|
0.000 |
0.000 |
0.368 |
0.105 |
0.000 |
|
| 1 spectrum, GETVTILAQSR |
0.000 |
|
0.489 |
|
0.000 |
0.000 |
0.450 |
0.006 |
0.054 |
|
| 2 spectra, GDSFFIR |
0.000 |
|
0.458 |
|
0.000 |
0.000 |
0.501 |
0.000 |
0.042 |
|
| 1 spectrum, SSEPVQHEESIR |
0.000 |
|
0.388 |
|
0.000 |
0.000 |
0.598 |
0.014 |
0.000 |
|
| 1 spectrum, LGSQIFIK |
0.014 |
|
0.411 |
|
0.000 |
0.000 |
0.453 |
0.086 |
0.036 |
|
| 2 spectra, GLDHEDYGR |
0.000 |
|
0.362 |
|
0.015 |
0.000 |
0.622 |
0.000 |
0.000 |
|
| 2 spectra, ETPQSLAFTR |
0.000 |
|
0.452 |
|
0.000 |
0.000 |
0.533 |
0.000 |
0.015 |
|
| 2 spectra, IGNELEK |
0.000 |
|
0.674 |
|
0.000 |
0.000 |
0.224 |
0.012 |
0.090 |
|
| 1 spectrum, DAGSEK |
0.000 |
|
0.463 |
|
0.000 |
0.000 |
0.398 |
0.075 |
0.064 |
|
| 7 spectra, LGHWLAVR |
0.000 |
|
0.716 |
|
0.007 |
0.000 |
0.278 |
0.000 |
0.000 |
|
| | | Plot |
|
Lyso |
|
|
|
|
|
|
|
Other |
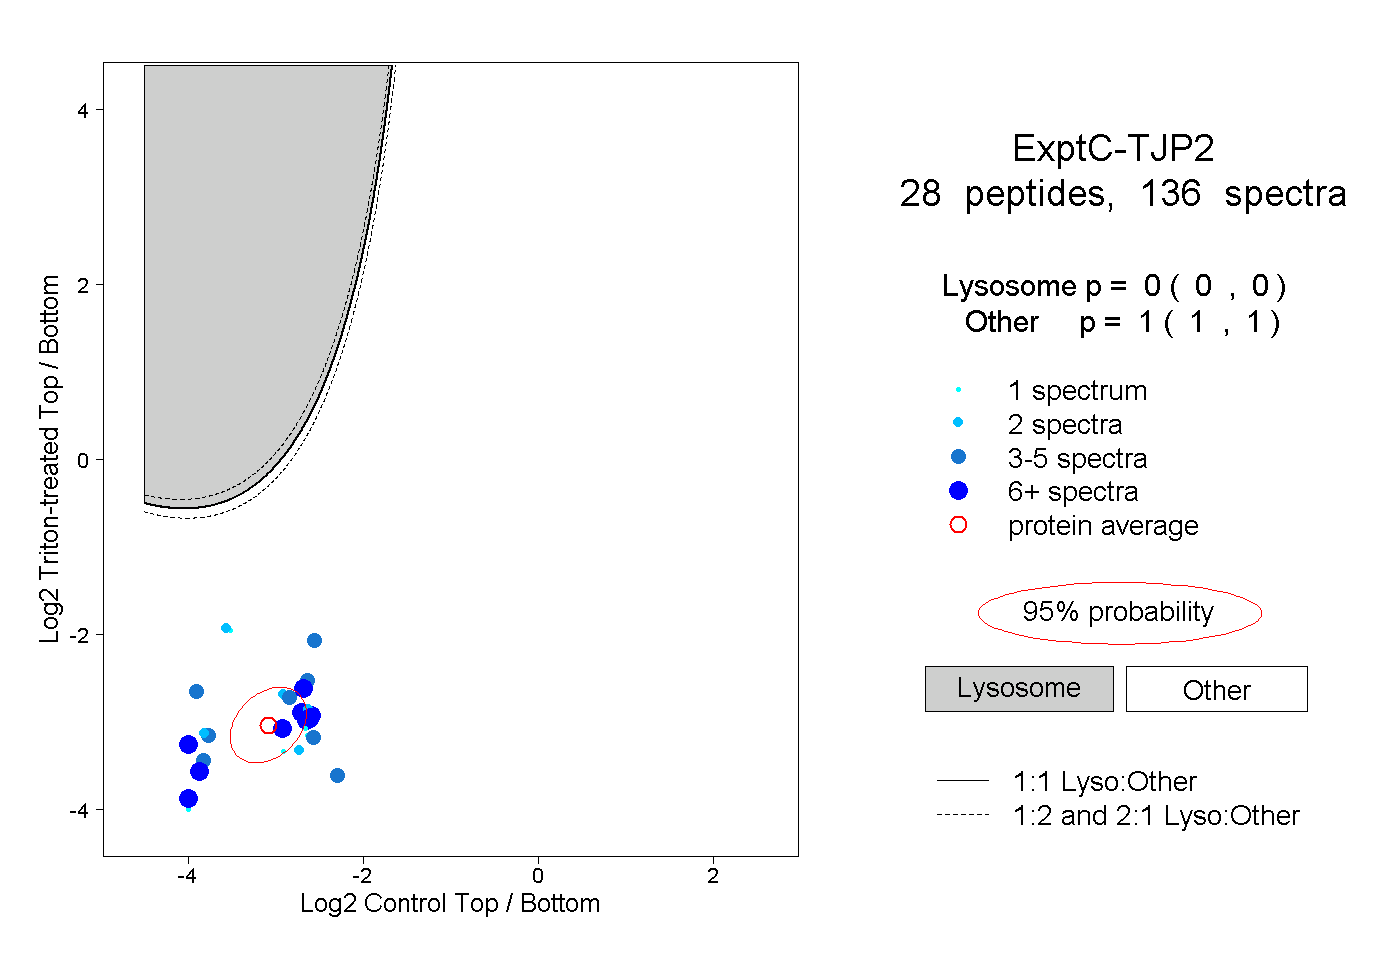
| Expt C |
28
peptides |
136
spectra |
 |
|
0.000
0.000 | 0.000 |
|
|
|
|
|
|
|
1.000
1.000 | 1.000 |
| | | Plot |
|
Lyso |
|
|
|
|
|
|
|
Other |
| Expt D |
10
peptides |
26
spectra |
 |
|
0.000
0.000 | 0.000 |
|
|
|
|
|
|
|
1.000
1.000 | 1.000 |