 3
3peptides
spectra
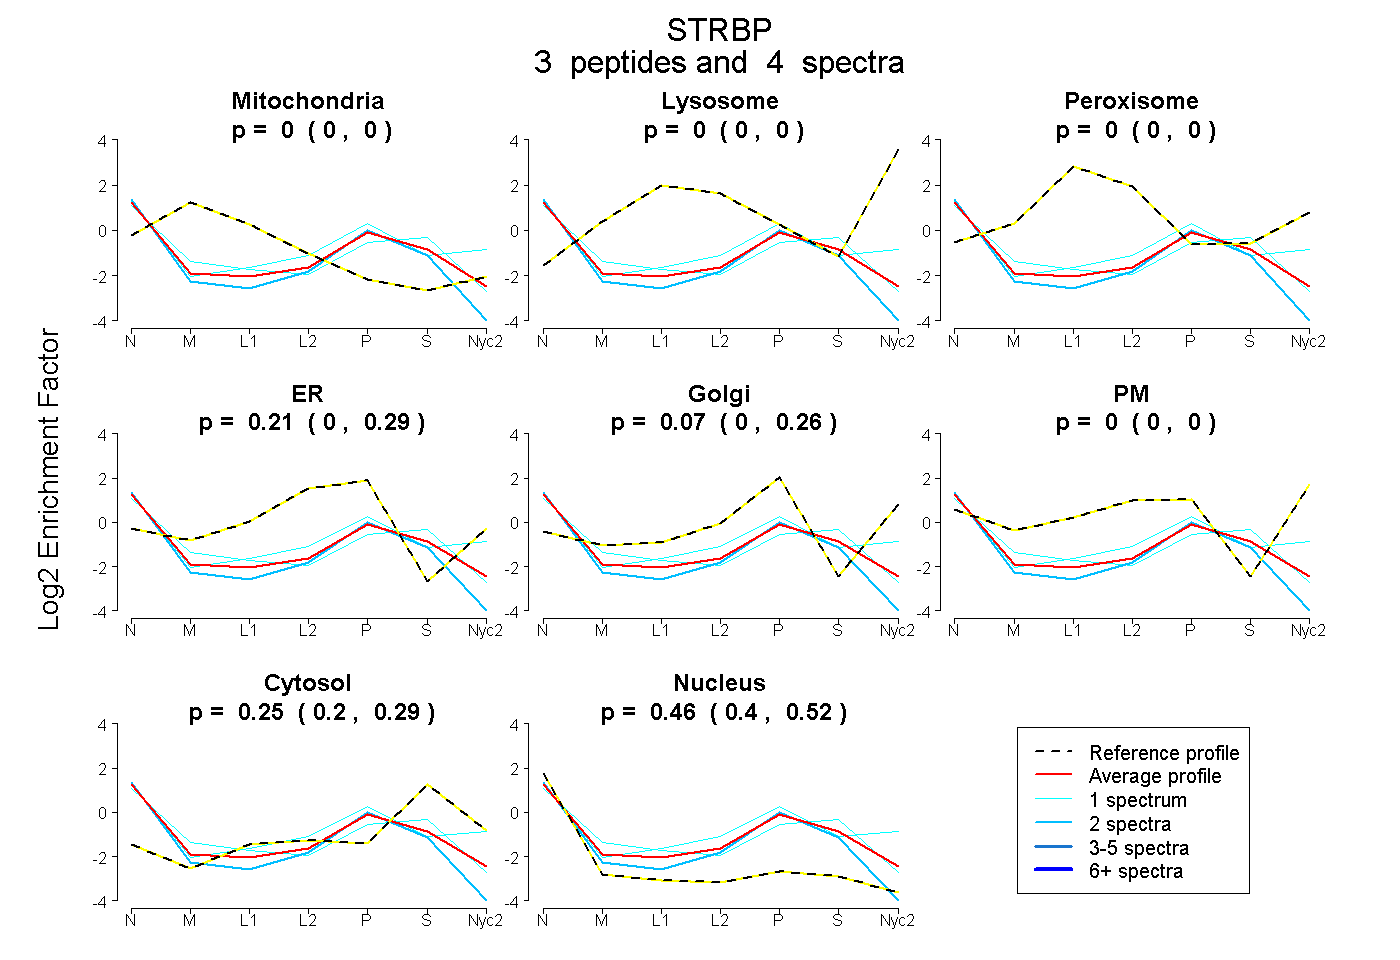
0.000 | 0.000
0.000 | 0.000
0.000 | 0.000
0.005 | 0.289
0.000 | 0.263
0.000 | 0.000
0.197 | 0.292
0.404 | 0.518
| Plot | Mito | Lyso | Perox | ER | Golgi | PM | Cytosol | Nucleus | |||||
| Expt A |
3 peptides |
4 spectra |
|
0.000 0.000 | 0.000 |
0.000 0.000 | 0.000 |
0.000 0.000 | 0.000 |
0.215 0.005 | 0.289 |
0.069 0.000 | 0.263 |
0.000 0.000 | 0.000 |
0.252 0.197 | 0.292 |
0.465 0.404 | 0.518 |
| 2 spectra, SIGTCNRPLGAGEALR | 0.000 | 0.000 | 0.000 | 0.213 | 0.000 | 0.000 | 0.148 | 0.639 | ||
| 1 spectrum, ASAALAALEK | 0.076 | 0.000 | 0.000 | 0.153 | 0.000 | 0.000 | 0.359 | 0.413 | ||
| 1 spectrum, LNQIRPGLQYK | 0.000 | 0.000 | 0.000 | 0.000 | 0.294 | 0.181 | 0.206 | 0.319 |