 4
4peptides
spectra
0.000 | 0.000
0.008 | 0.136
0.000 | 0.063
0.000 | 0.096
0.000 | 0.000
0.000 | 0.121
0.783 | 0.842
0.000 | 0.000
3peptides
spectra
0.000 | 0.000
1.000 | 1.000
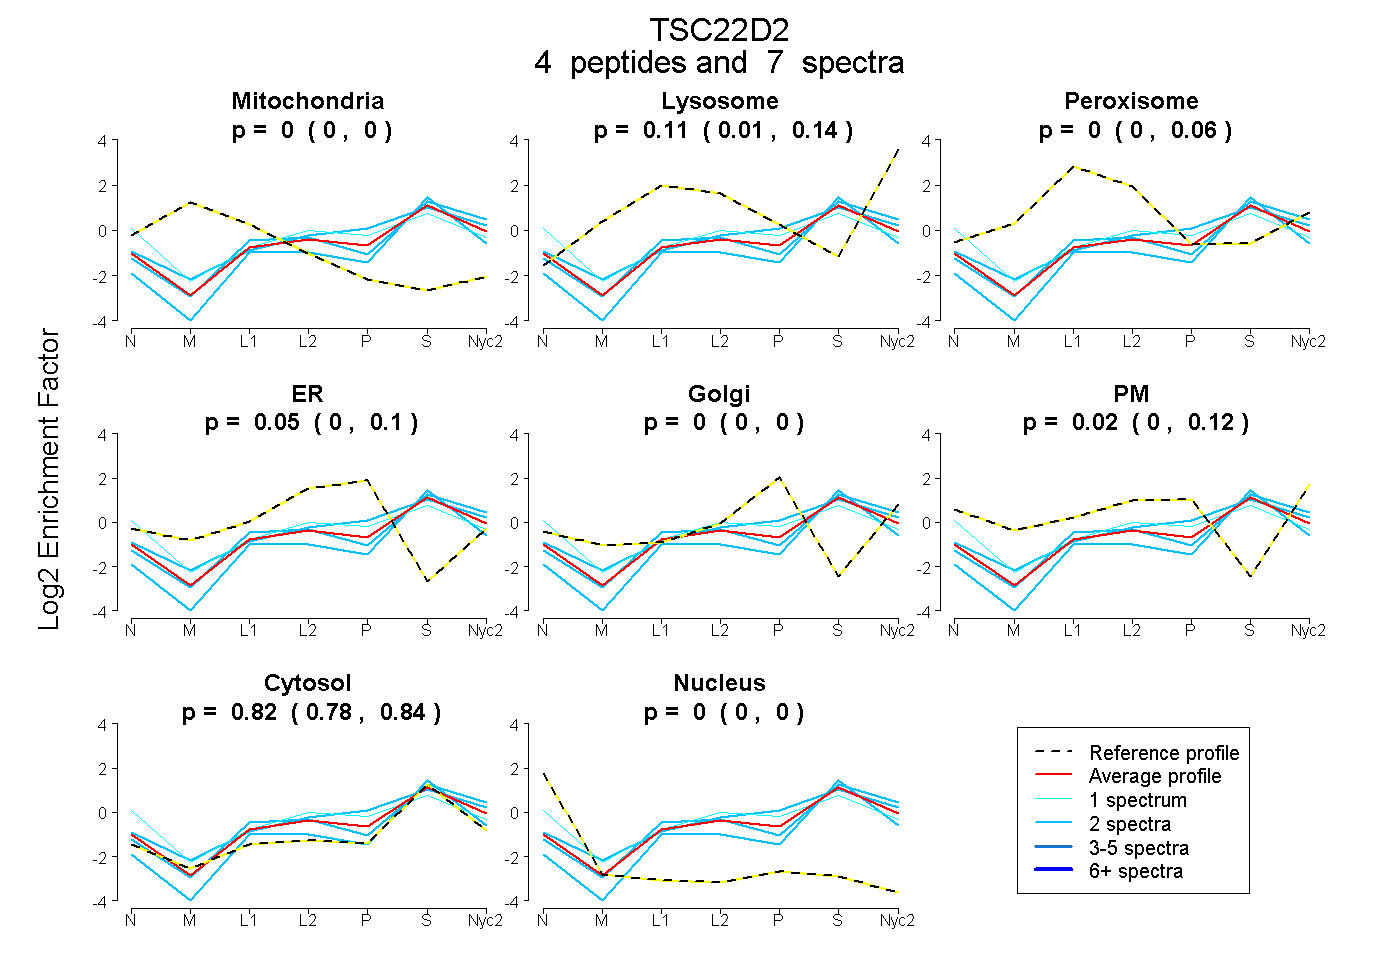
| Plot | Mito | Lyso | Perox | ER | Golgi | PM | Cytosol | Nucleus | |||||
| Expt A |
4 peptides |
7 spectra |
|
0.000 0.000 | 0.000 |
0.106 0.008 | 0.136 |
0.002 0.000 | 0.063 |
0.053 0.000 | 0.096 |
0.000 0.000 | 0.000 |
0.021 0.000 | 0.121 |
0.818 0.783 | 0.842 |
0.000 0.000 | 0.000 |
||
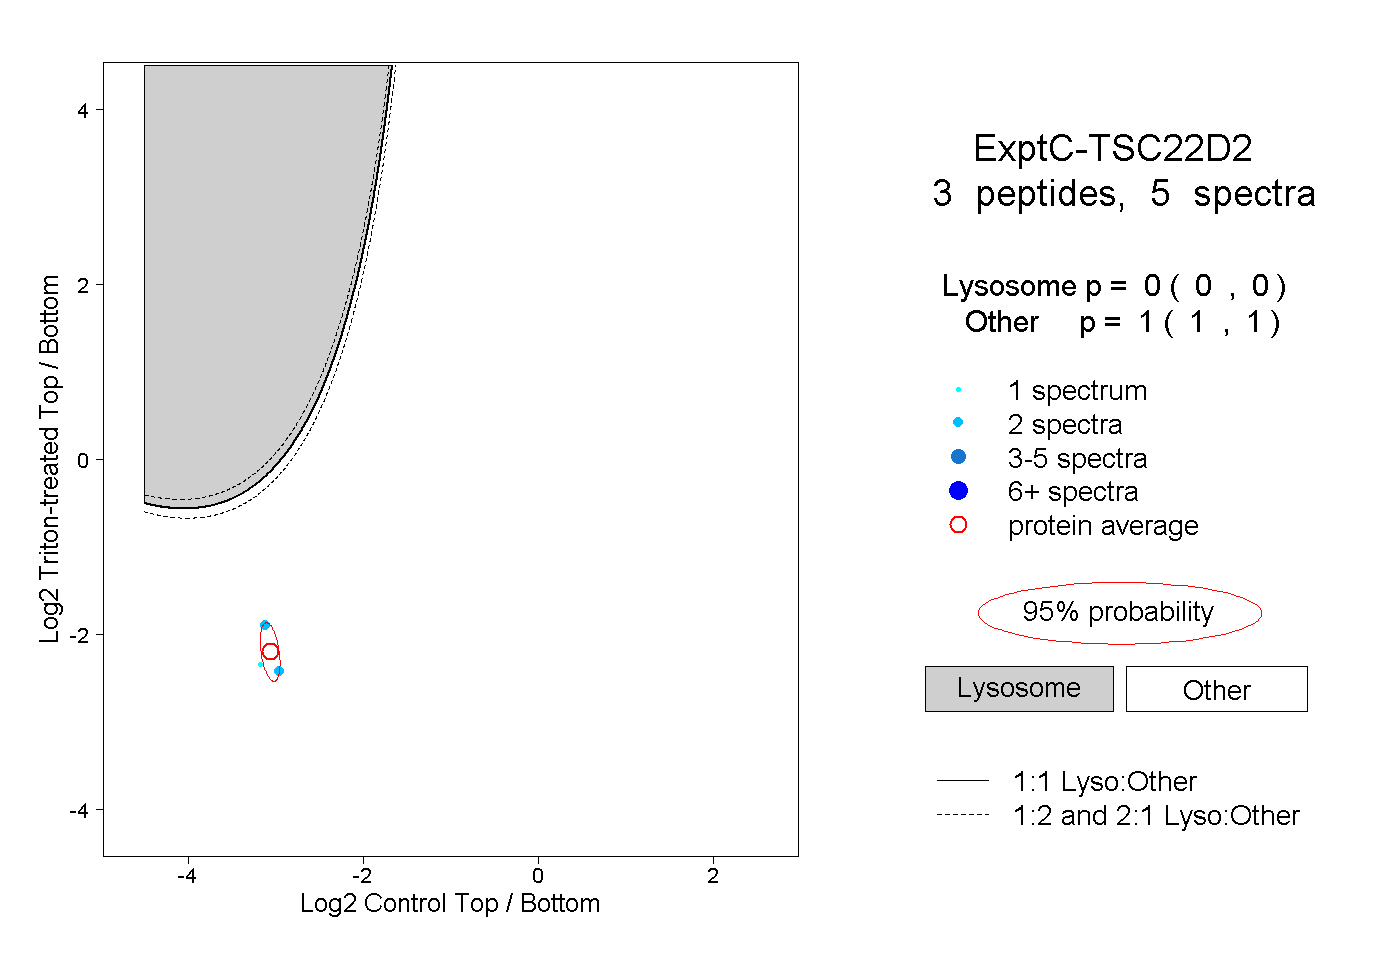
| Plot | Lyso | Other | |||||||||||
| Expt C |
3 peptides |
5 spectra |
|
0.000 0.000 | 0.000 |
1.000 1.000 | 1.000 |