 5
5peptides
spectra
0.000 | 0.038
0.000 | 0.000
0.063 | 0.144
0.030 | 0.199
0.000 | 0.105
0.000 | 0.038
0.683 | 0.747
0.000 | 0.000
| Plot | Mito | Lyso | Perox | ER | Golgi | PM | Cytosol | Nucleus | |||||
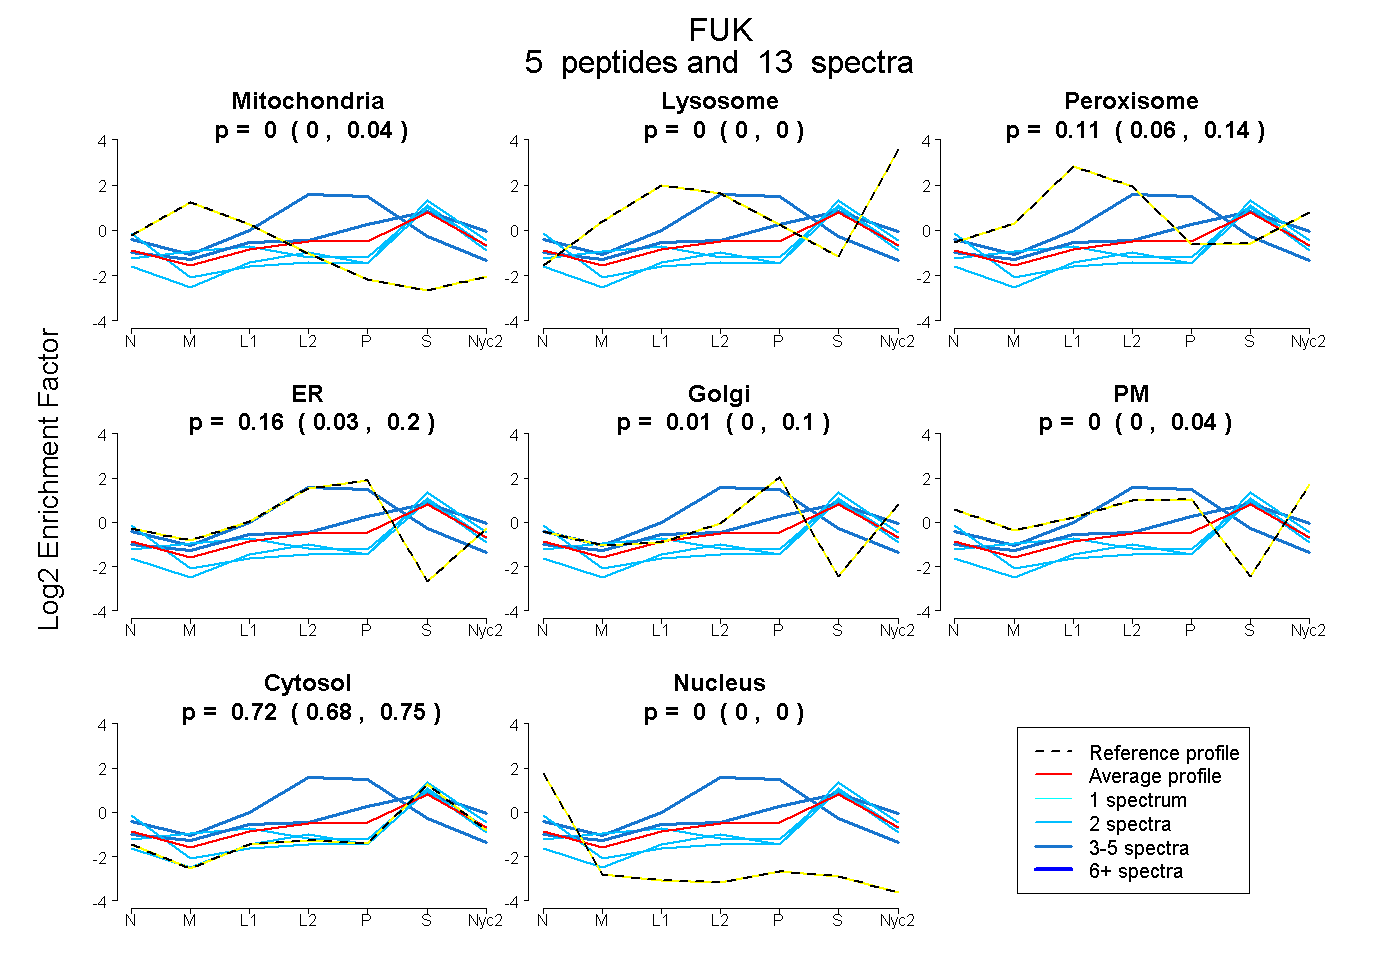
| Expt A |
5 peptides |
13 spectra |
|
0.000 0.000 | 0.038 |
0.000 0.000 | 0.000 |
0.106 0.063 | 0.144 |
0.160 0.030 | 0.199 |
0.009 0.000 | 0.105 |
0.000 0.000 | 0.038 |
0.724 0.683 | 0.747 |
0.000 0.000 | 0.000 |
| 2 spectra, VAAGAEDPGVAAR | 0.000 | 0.041 | 0.000 | 0.000 | 0.000 | 0.000 | 0.959 | 0.000 | ||
| 4 spectra, LFPVLHPTR | 0.000 | 0.051 | 0.141 | 0.000 | 0.221 | 0.000 | 0.587 | 0.000 | ||
| 3 spectra, CLLSAR | 0.000 | 0.000 | 0.099 | 0.635 | 0.000 | 0.000 | 0.266 | 0.000 | ||
| 2 spectra, QAVMTAR | 0.000 | 0.000 | 0.017 | 0.000 | 0.000 | 0.055 | 0.795 | 0.134 | ||
| 2 spectra, GVEALAQER | 0.145 | 0.035 | 0.082 | 0.000 | 0.000 | 0.000 | 0.737 | 0.000 |
| Plot | Lyso | Other | |||||||||||
| Expt C |
3 peptides |
6 spectra |
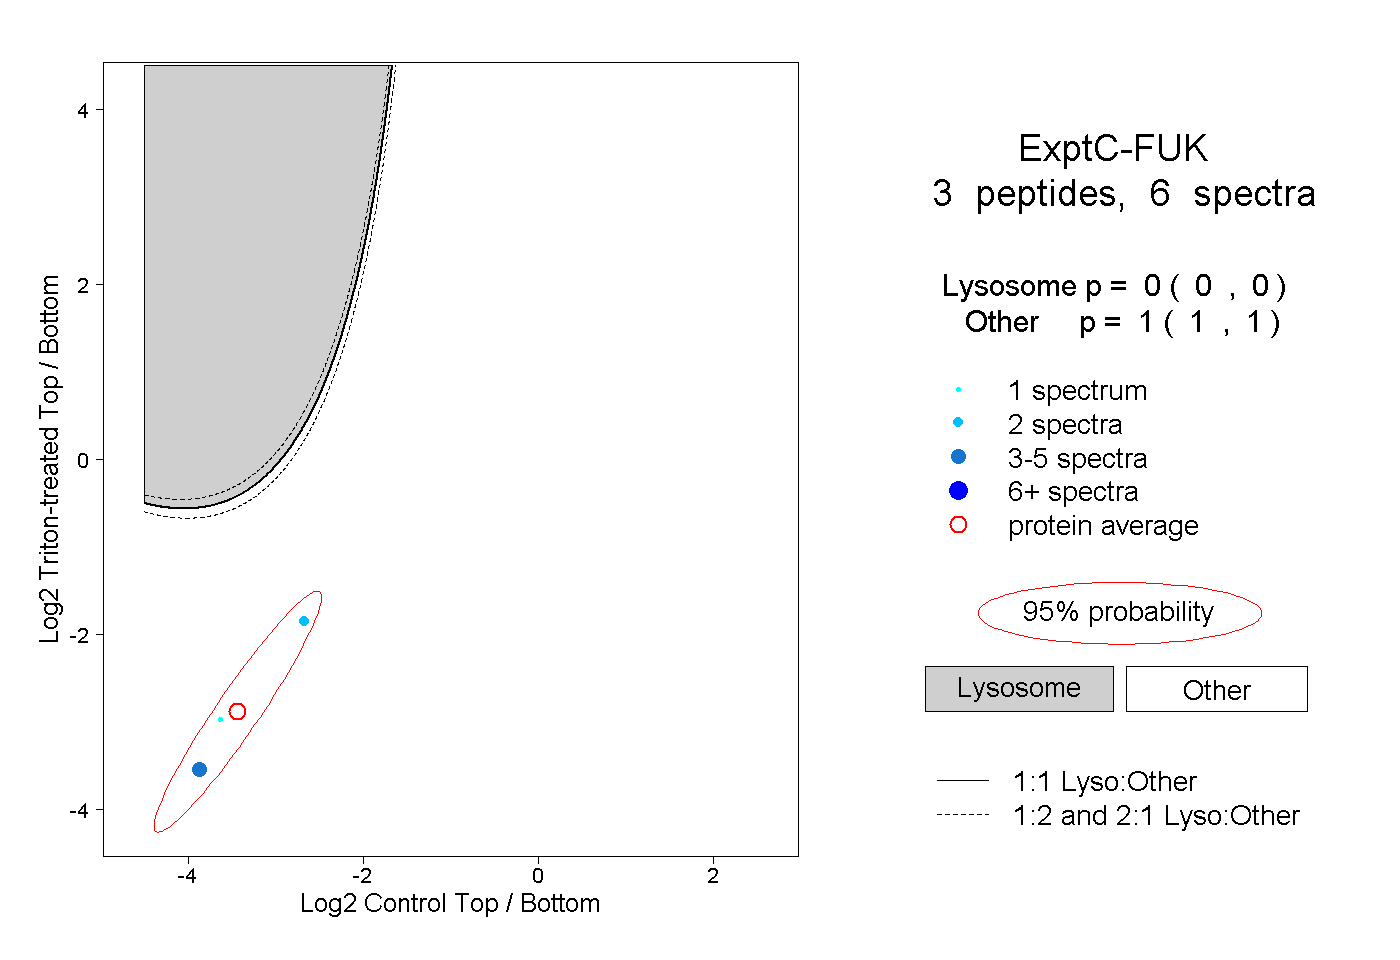 |
0.000 0.000 | 0.000 |
1.000 1.000 | 1.000 |