12
12peptides
spectra
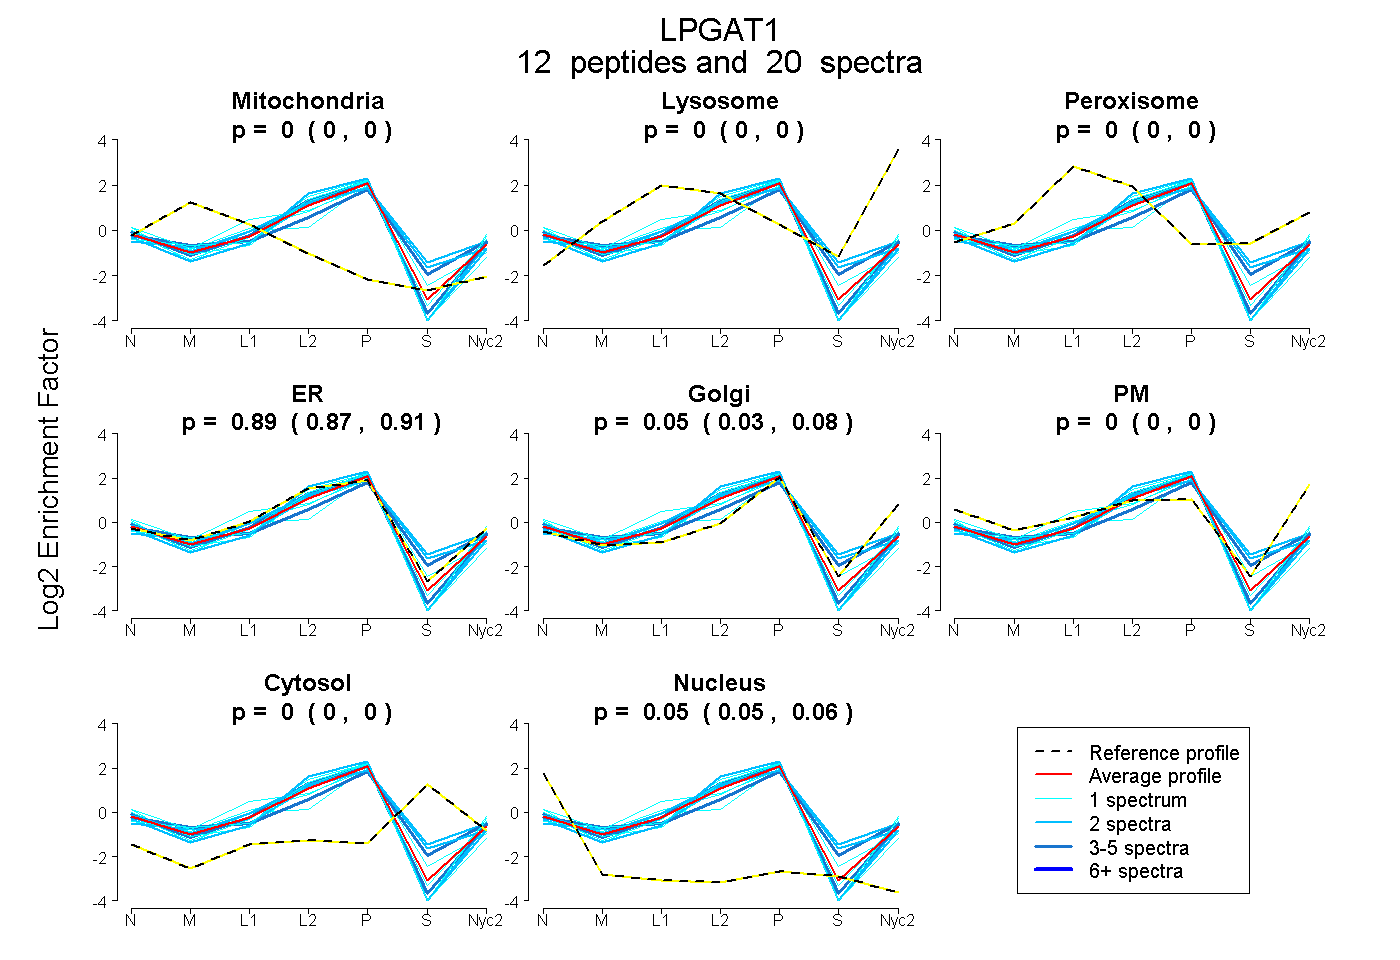
0.000 | 0.000
0.000 | 0.000
0.000 | 0.000
0.866 | 0.910
0.032 | 0.075
0.000 | 0.000
0.000 | 0.000
0.050 | 0.058
8peptides
spectra
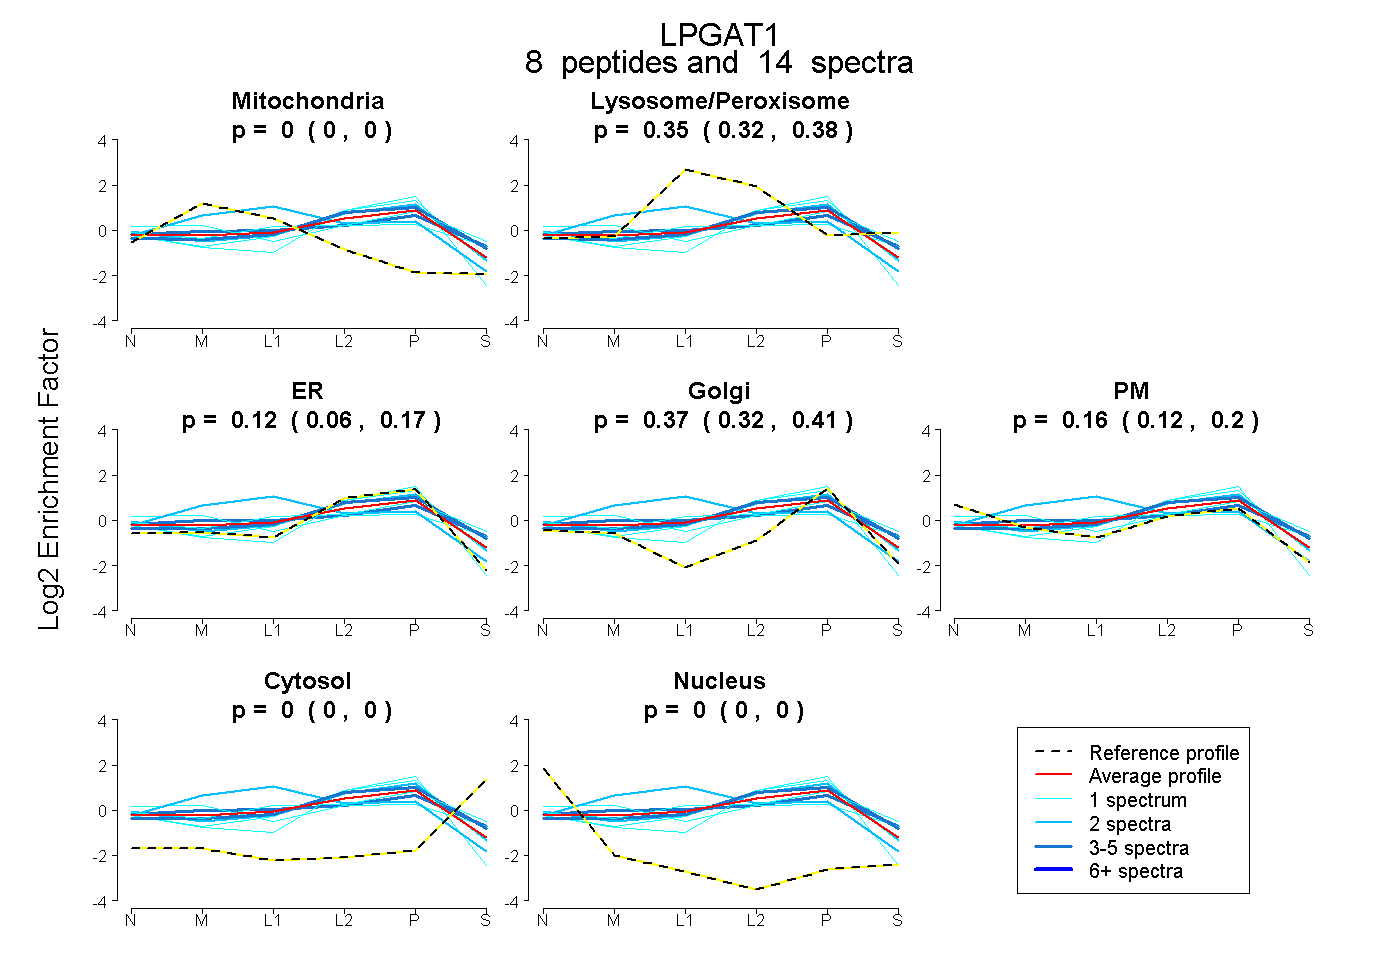
0.000 | 0.000
0.316 | 0.376
0.063 | 0.168
0.316 | 0.413
0.124 | 0.196
0.000 | 0.000
0.000 | 0.000