 12
12peptides
spectra
0.000 | 0.000
0.000 | 0.000
0.000 | 0.000
0.866 | 0.910
0.032 | 0.075
0.000 | 0.000
0.000 | 0.000
0.050 | 0.058
| Plot | Mito | Lyso | Perox | ER | Golgi | PM | Cytosol | Nucleus | |||||
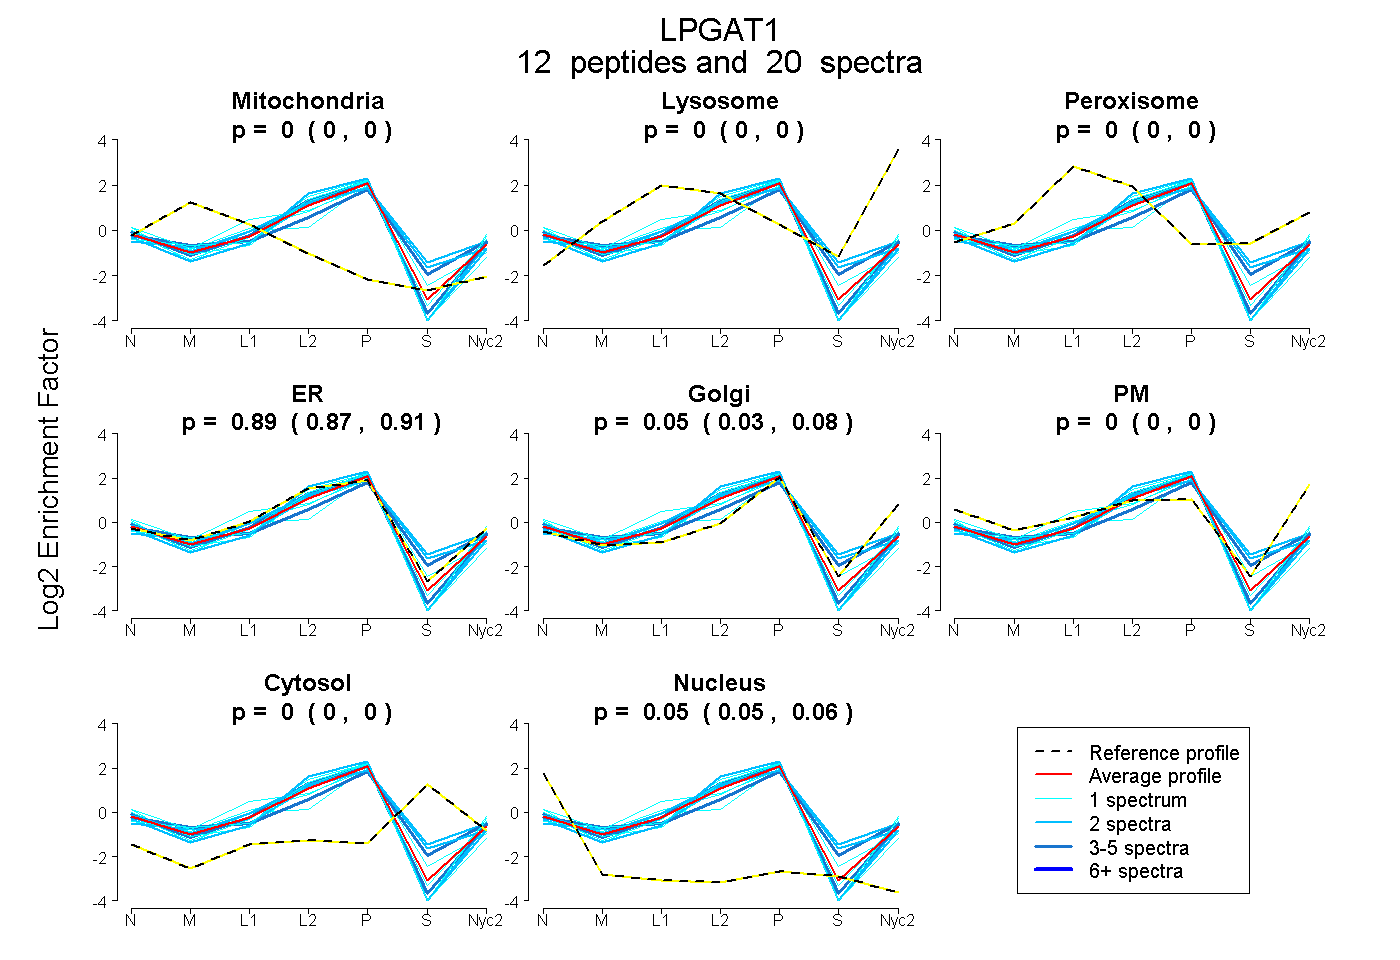
| Expt A |
12 peptides |
20 spectra |
|
0.000 0.000 | 0.000 |
0.000 0.000 | 0.000 |
0.000 0.000 | 0.000 |
0.891 0.866 | 0.910 |
0.055 0.032 | 0.075 |
0.000 0.000 | 0.000 |
0.000 0.000 | 0.000 |
0.054 0.050 | 0.058 |
| 1 spectrum, AVTVEEAPWLGWIVAK | 0.000 | 0.000 | 0.000 | 0.677 | 0.192 | 0.000 | 0.000 | 0.130 | ||
| 1 spectrum, FGATNIILK | 0.000 | 0.000 | 0.000 | 0.801 | 0.164 | 0.000 | 0.000 | 0.035 | ||
| 1 spectrum, WIVLFPEGGFLR | 0.000 | 0.000 | 0.000 | 0.941 | 0.000 | 0.000 | 0.000 | 0.059 | ||
| 2 spectra, QENGSPAGGDAR | 0.000 | 0.000 | 0.000 | 0.957 | 0.000 | 0.000 | 0.000 | 0.043 | ||
| 2 spectra, DQQLLVLK | 0.000 | 0.000 | 0.010 | 0.834 | 0.000 | 0.000 | 0.156 | 0.000 | ||
| 2 spectra, TGAFPPPQGQK | 0.000 | 0.000 | 0.000 | 0.866 | 0.000 | 0.000 | 0.134 | 0.000 | ||
| 3 spectra, HLEHNYR | 0.032 | 0.000 | 0.000 | 0.608 | 0.253 | 0.000 | 0.089 | 0.019 | ||
| 1 spectrum, KPTVTHVHYR | 0.035 | 0.000 | 0.000 | 0.885 | 0.000 | 0.053 | 0.000 | 0.027 | ||
| 1 spectrum, NNLPFLTHVTLPR | 0.000 | 0.000 | 0.000 | 0.947 | 0.032 | 0.000 | 0.000 | 0.021 | ||
| 1 spectrum, AEPIDIQTWILGYR | 0.000 | 0.000 | 0.000 | 0.918 | 0.018 | 0.000 | 0.000 | 0.064 | ||
| 2 spectra, EDLLSHFYK | 0.000 | 0.000 | 0.000 | 0.894 | 0.070 | 0.000 | 0.000 | 0.035 | ||
| 3 spectra, ETSQAFAK | 0.000 | 0.000 | 0.000 | 0.956 | 0.000 | 0.000 | 0.000 | 0.044 |
| Plot | Mito | Lyso or Perox | ER | Golgi | PM | Cytosol | Nucleus | ||||||
| Expt B |
8 peptides |
14 spectra |
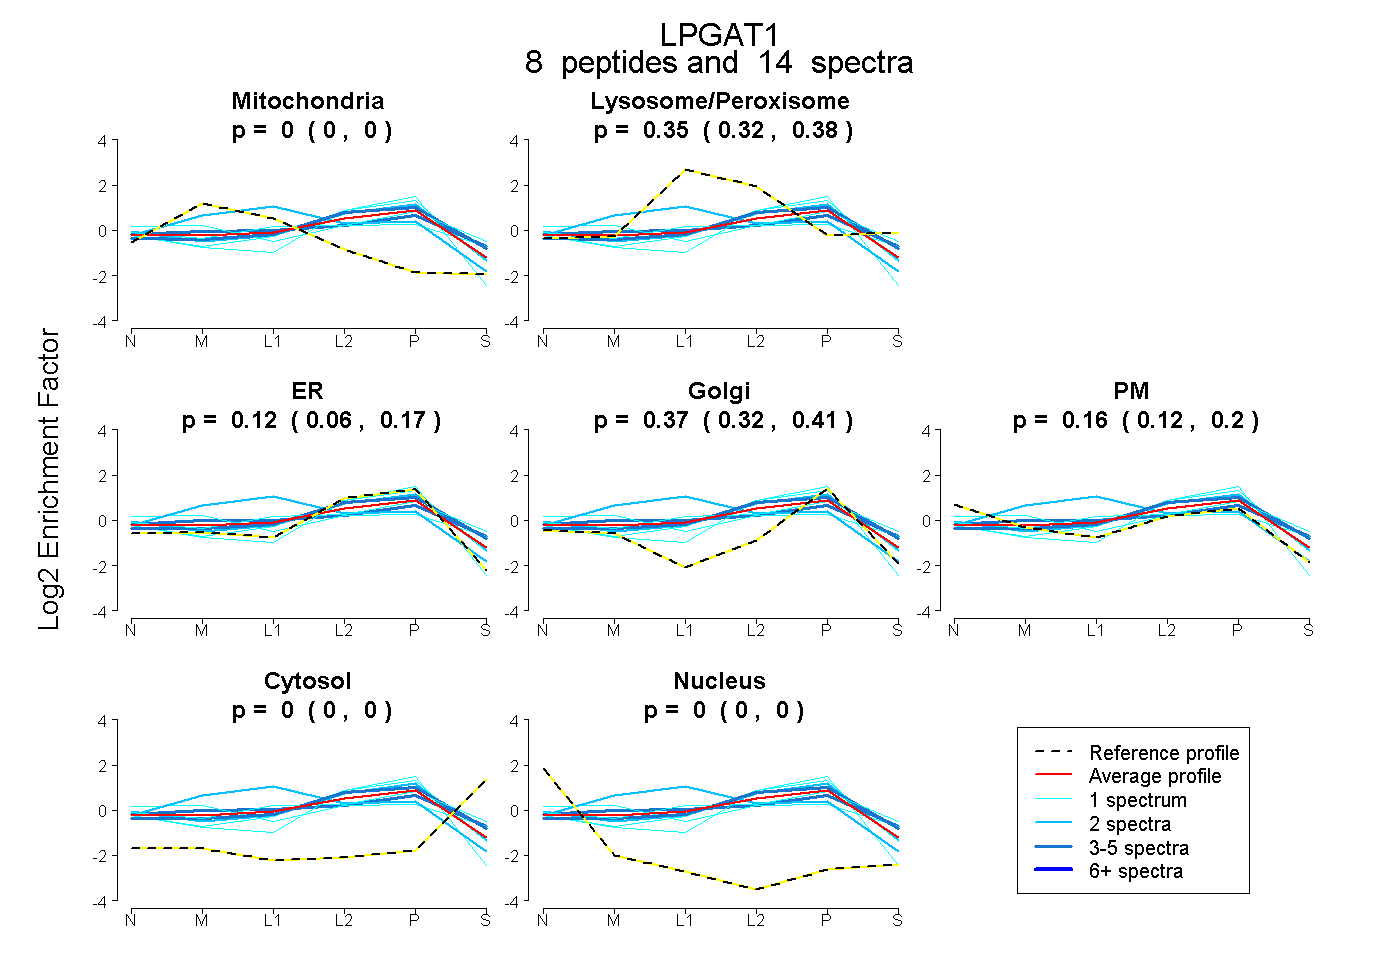 |
0.000 0.000 | 0.000 |
0.347 0.316 | 0.376 |
0.119 0.063 | 0.168 |
0.370 0.316 | 0.413 |
0.163 0.124 | 0.196 |
0.000 0.000 | 0.000 |
0.000 0.000 | 0.000 |
|||
| Plot | Lyso | Other | |||||||||||
| Expt C |
8 peptides |
25 spectra |
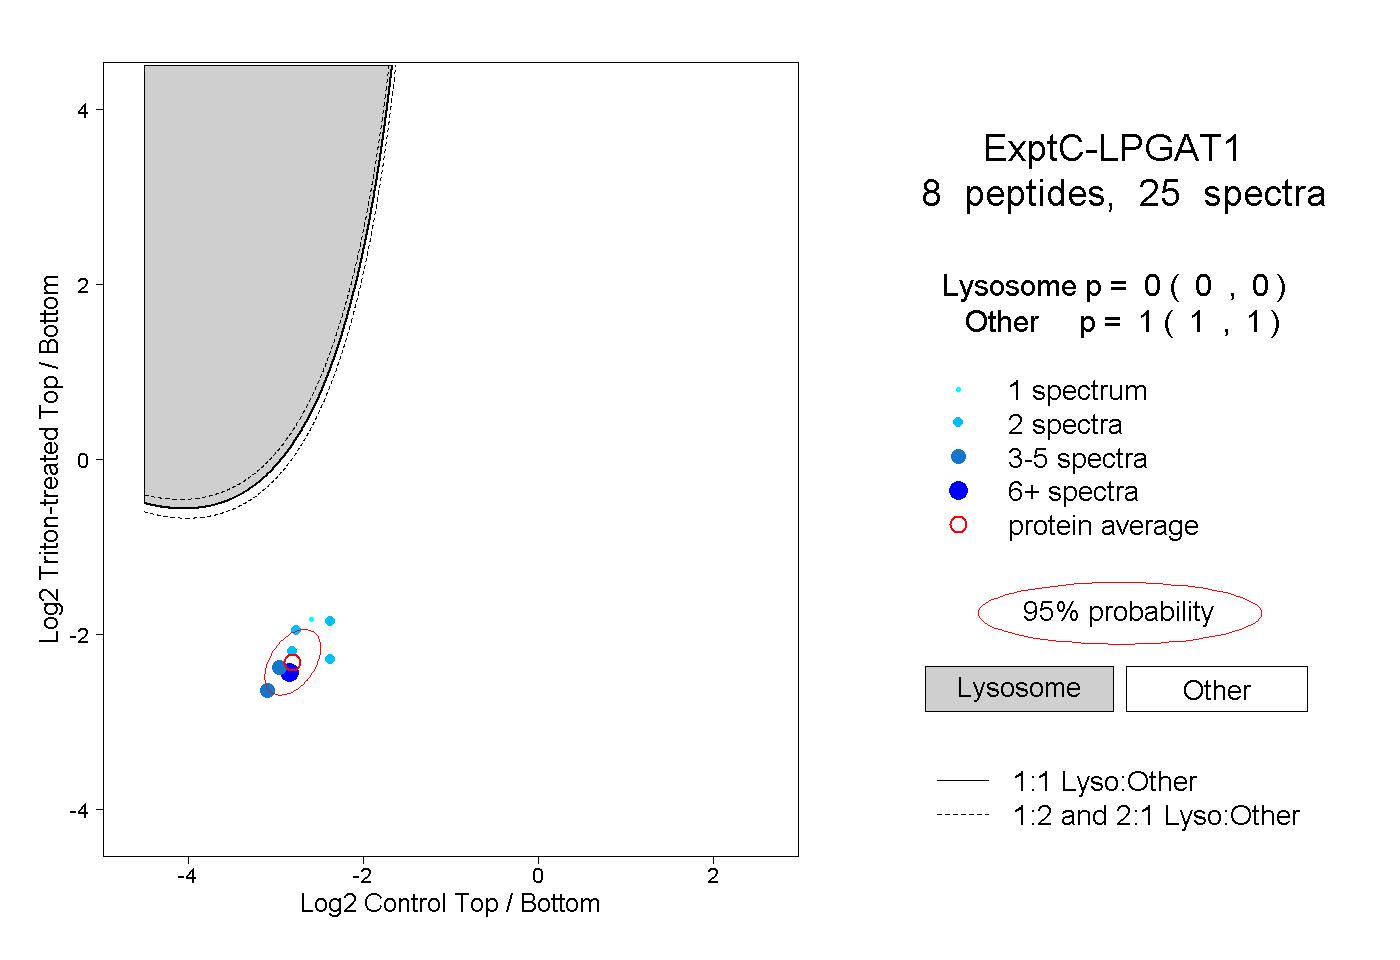 |
0.000 0.000 | 0.000 |
1.000 1.000 | 1.000 |
||||||||
| Plot | Lyso | Other | |||||||||||
| Expt D |
1 peptide |
1 spectrum |
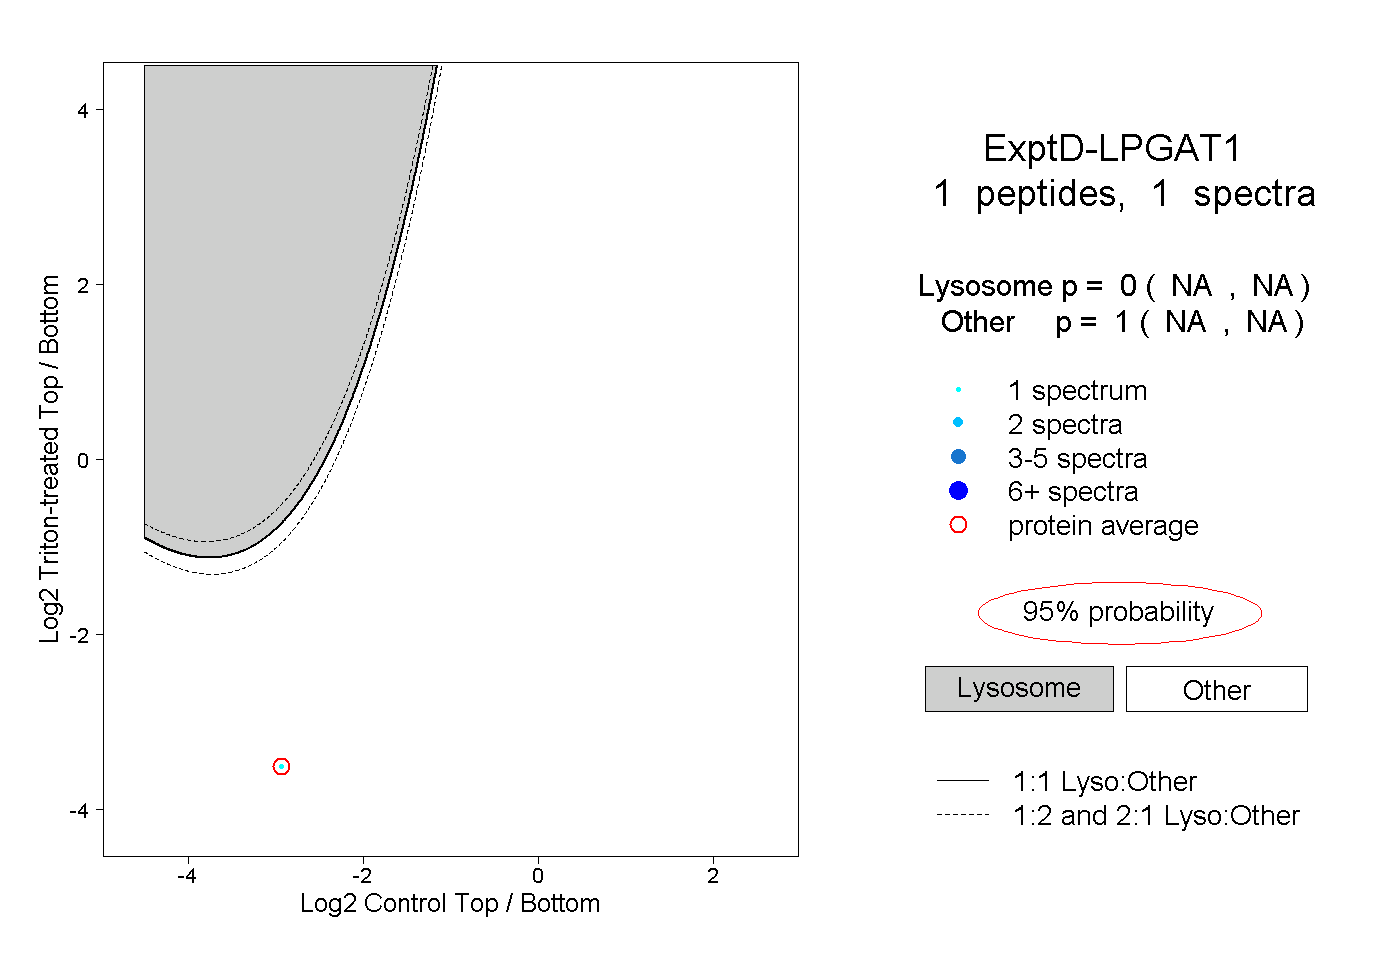 |
0.000 NA | NA |
1.000 NA | NA |