 3
3peptides
spectra
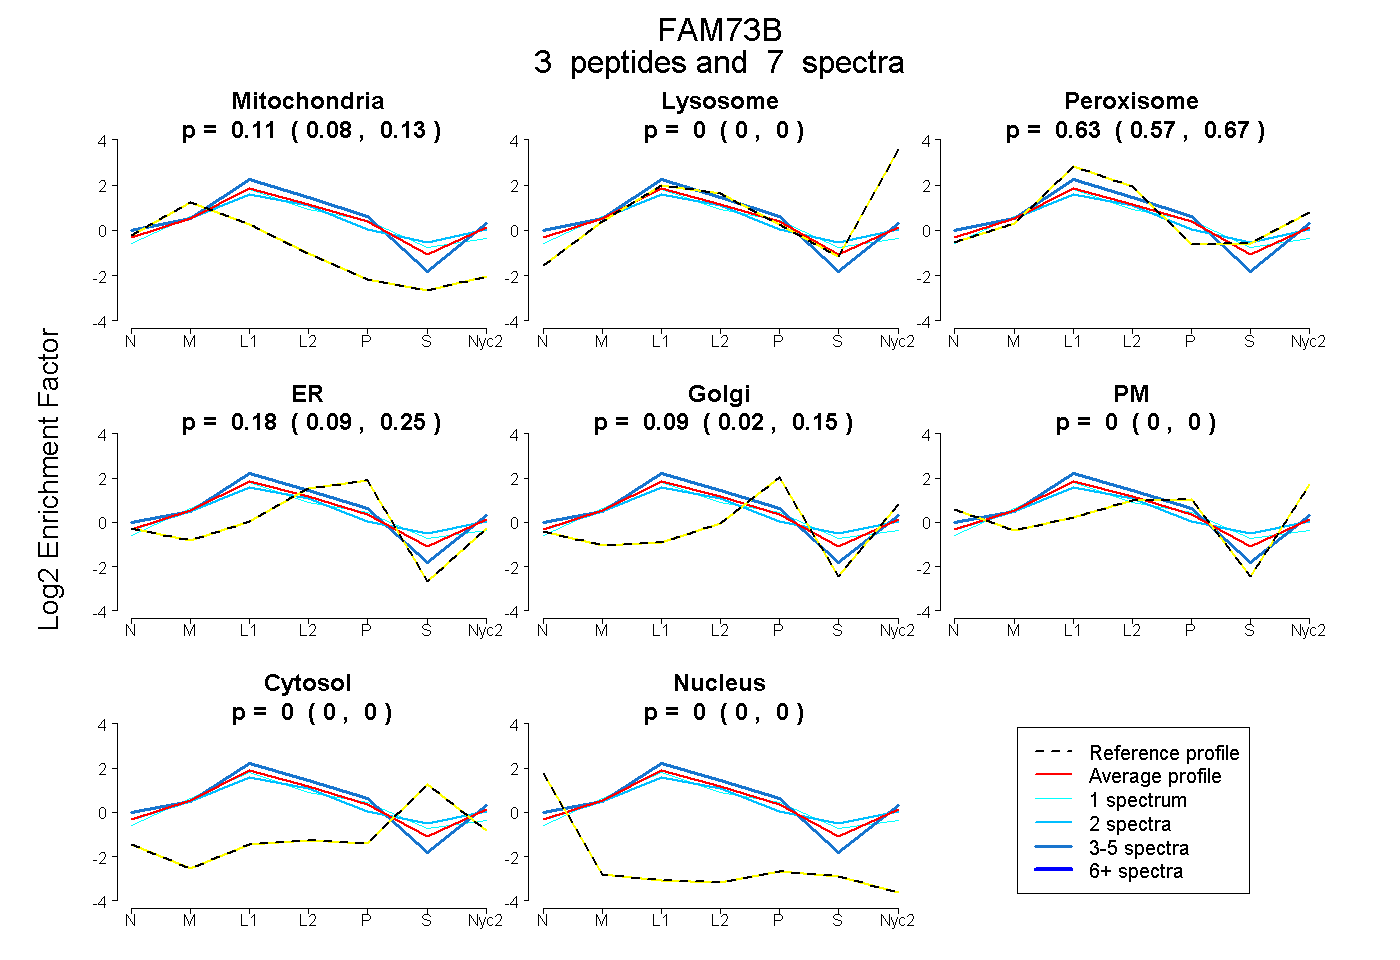
0.076 | 0.127
0.000 | 0.000
0.571 | 0.669
0.085 | 0.252
0.020 | 0.150
0.000 | 0.000
0.000 | 0.000
0.000 | 0.000
| Plot | Mito | Lyso | Perox | ER | Golgi | PM | Cytosol | Nucleus | |||||
| Expt A |
3 peptides |
7 spectra |
|
0.105 0.076 | 0.127 |
0.000 0.000 | 0.000 |
0.625 0.571 | 0.669 |
0.178 0.085 | 0.252 |
0.091 0.020 | 0.150 |
0.000 0.000 | 0.000 |
0.000 0.000 | 0.000 |
0.000 0.000 | 0.000 |
| 2 spectra, QAFEGLLEER | 0.112 | 0.000 | 0.640 | 0.093 | 0.085 | 0.000 | 0.069 | 0.000 | ||
| 4 spectra, LESLLHR | 0.055 | 0.000 | 0.572 | 0.287 | 0.000 | 0.085 | 0.000 | 0.000 | ||
| 1 spectrum, DMFDLDNVR | 0.146 | 0.000 | 0.574 | 0.229 | 0.011 | 0.000 | 0.039 | 0.000 |
| Plot | Lyso | Other | |||||||||||
| Expt C |
2 peptides |
9 spectra |
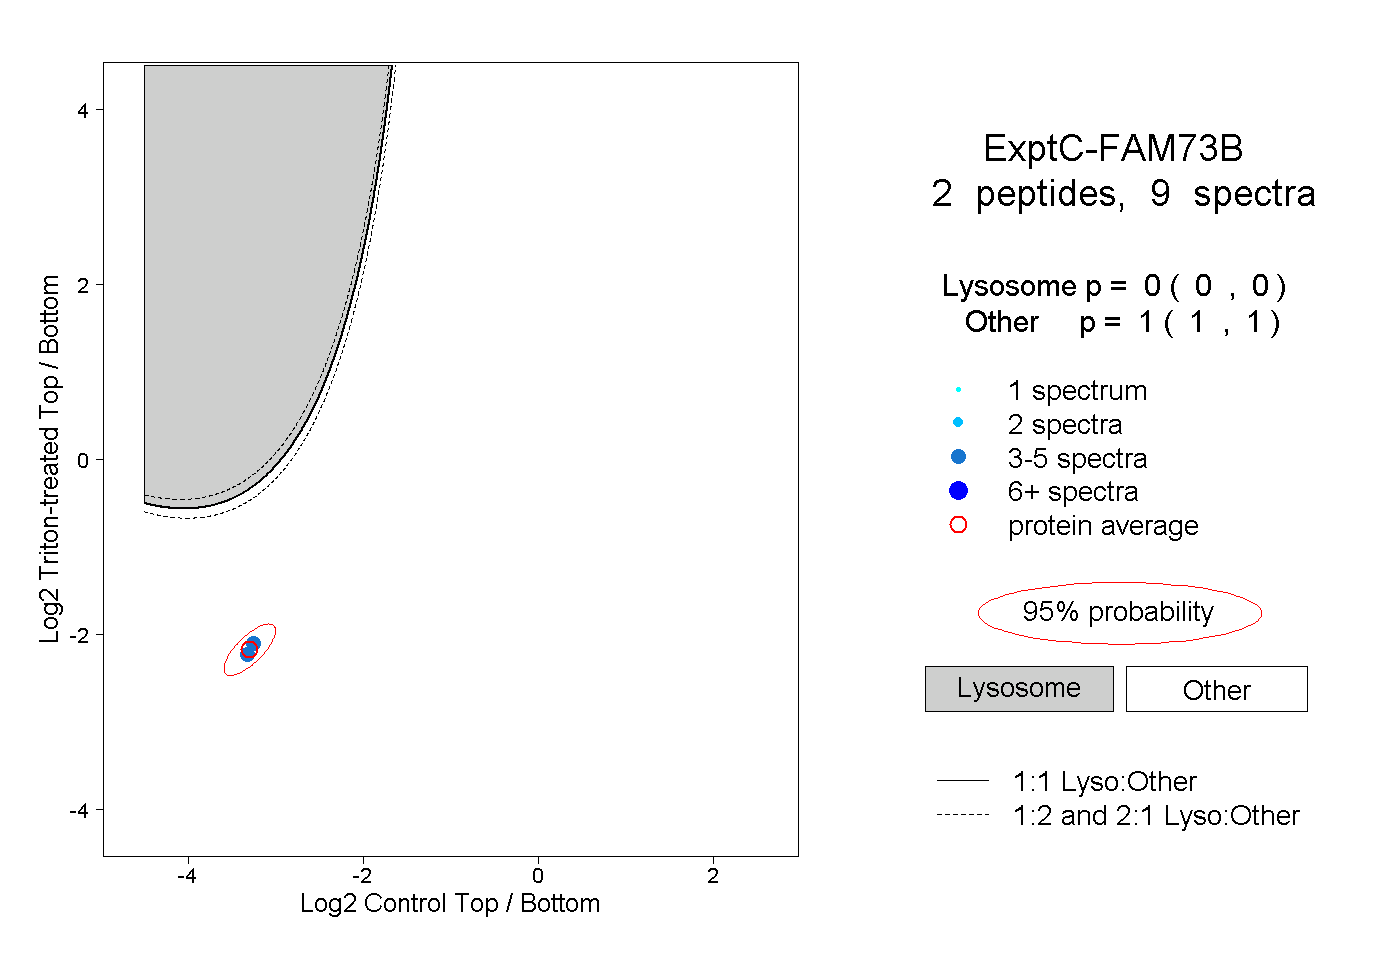 |
0.000 0.000 | 0.000 |
1.000 1.000 | 1.000 |
||||||||
| Plot | Lyso | Other | |||||||||||
| Expt D |
2 peptides |
3 spectra |
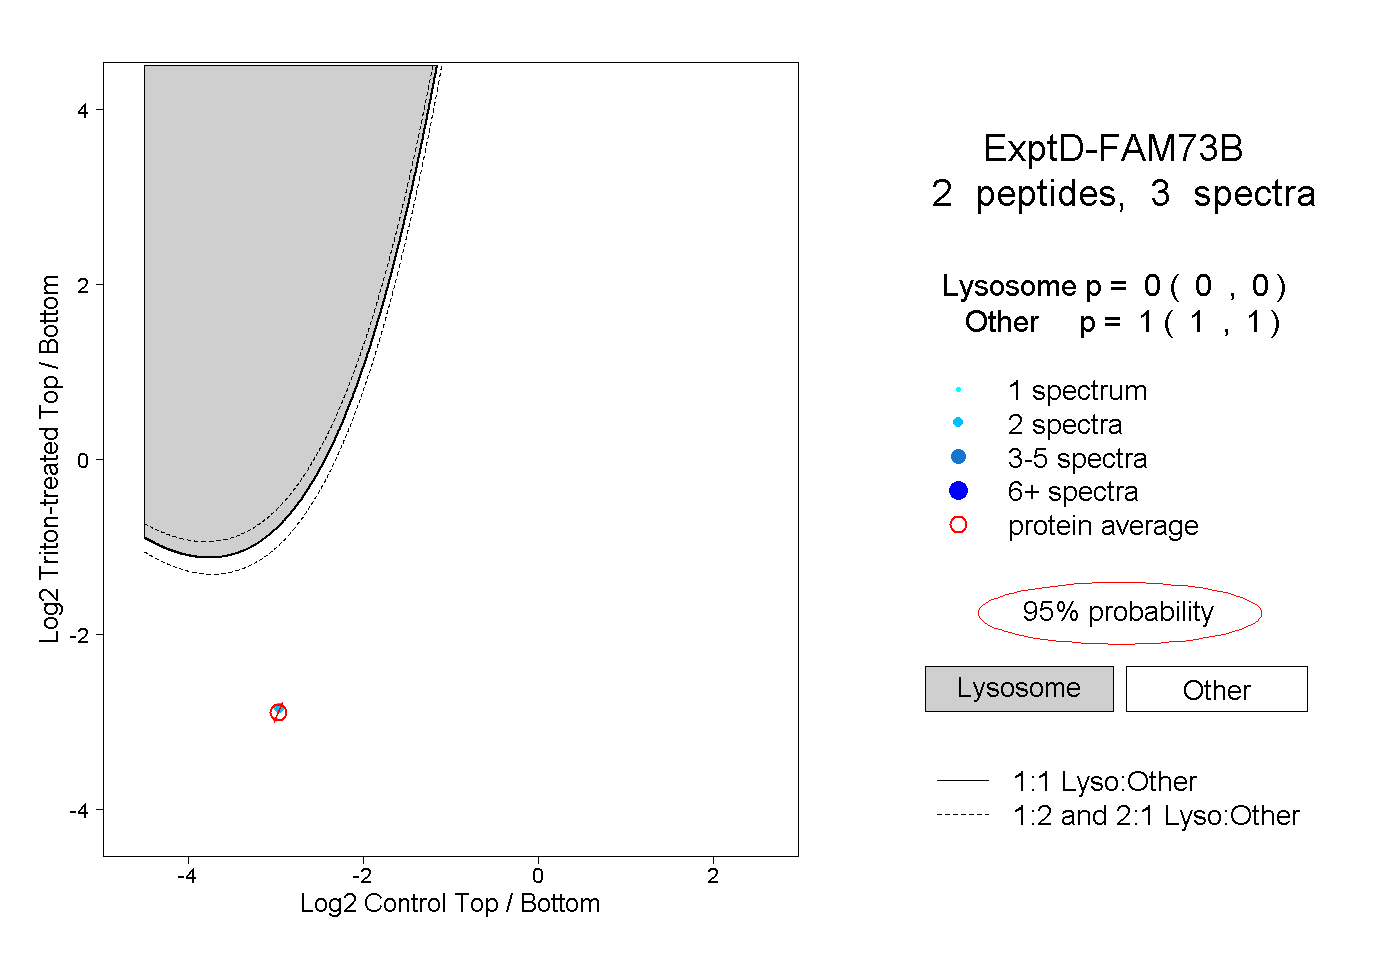 |
0.000 0.000 | 0.000 |
1.000 1.000 | 1.000 |