 1
1peptide
spectra
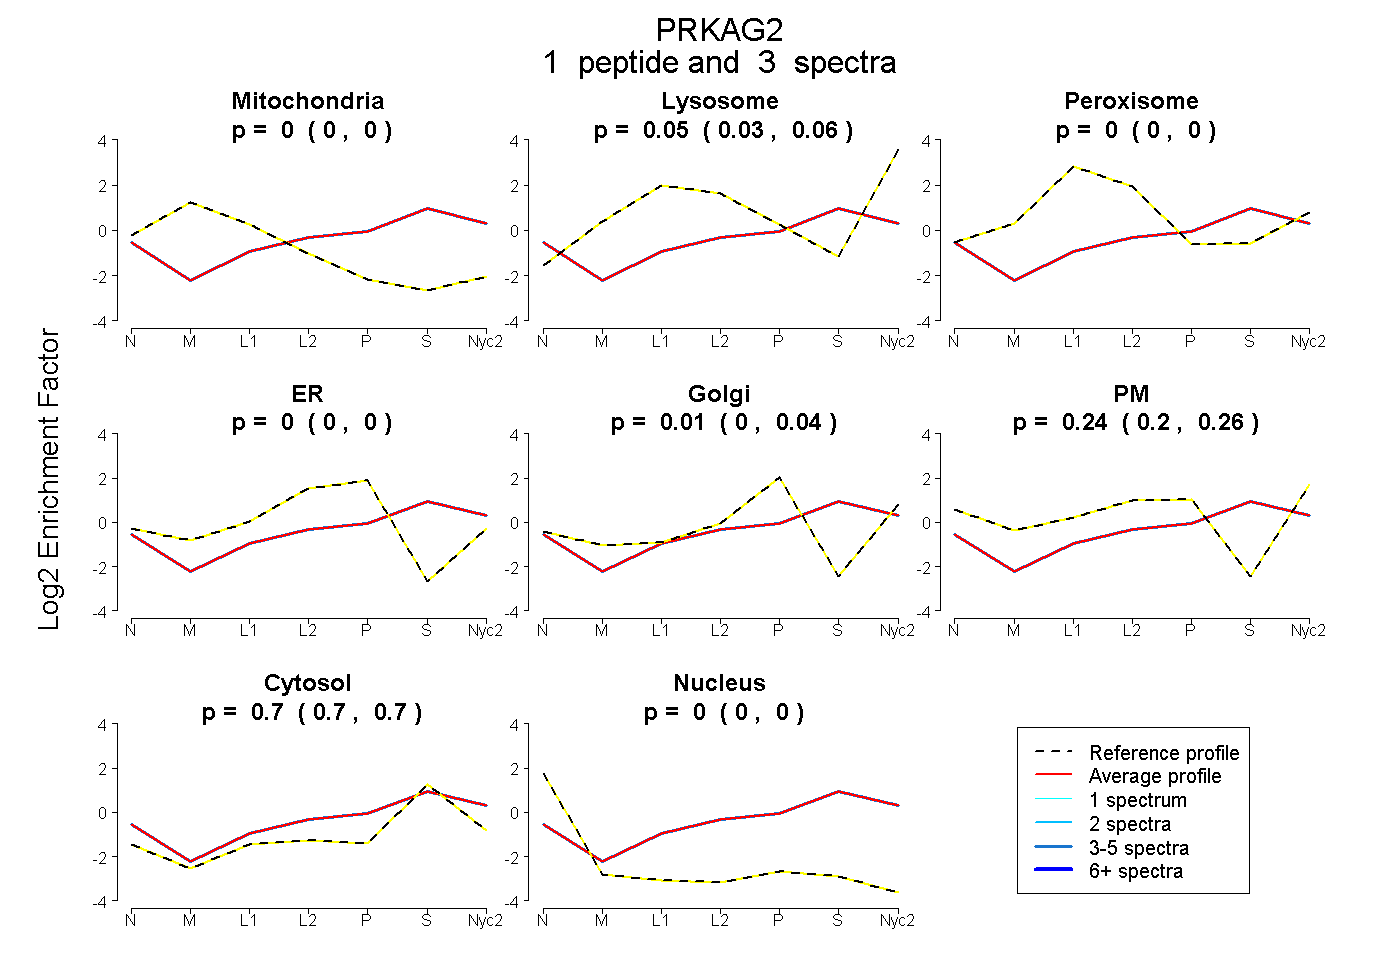
0.000 | 0.000
0.035 | 0.064
0.000 | 0.000
0.000 | 0.000
0.000 | 0.035
0.196 | 0.262
0.696 | 0.705
0.000 | 0.000
1peptide
spectrum
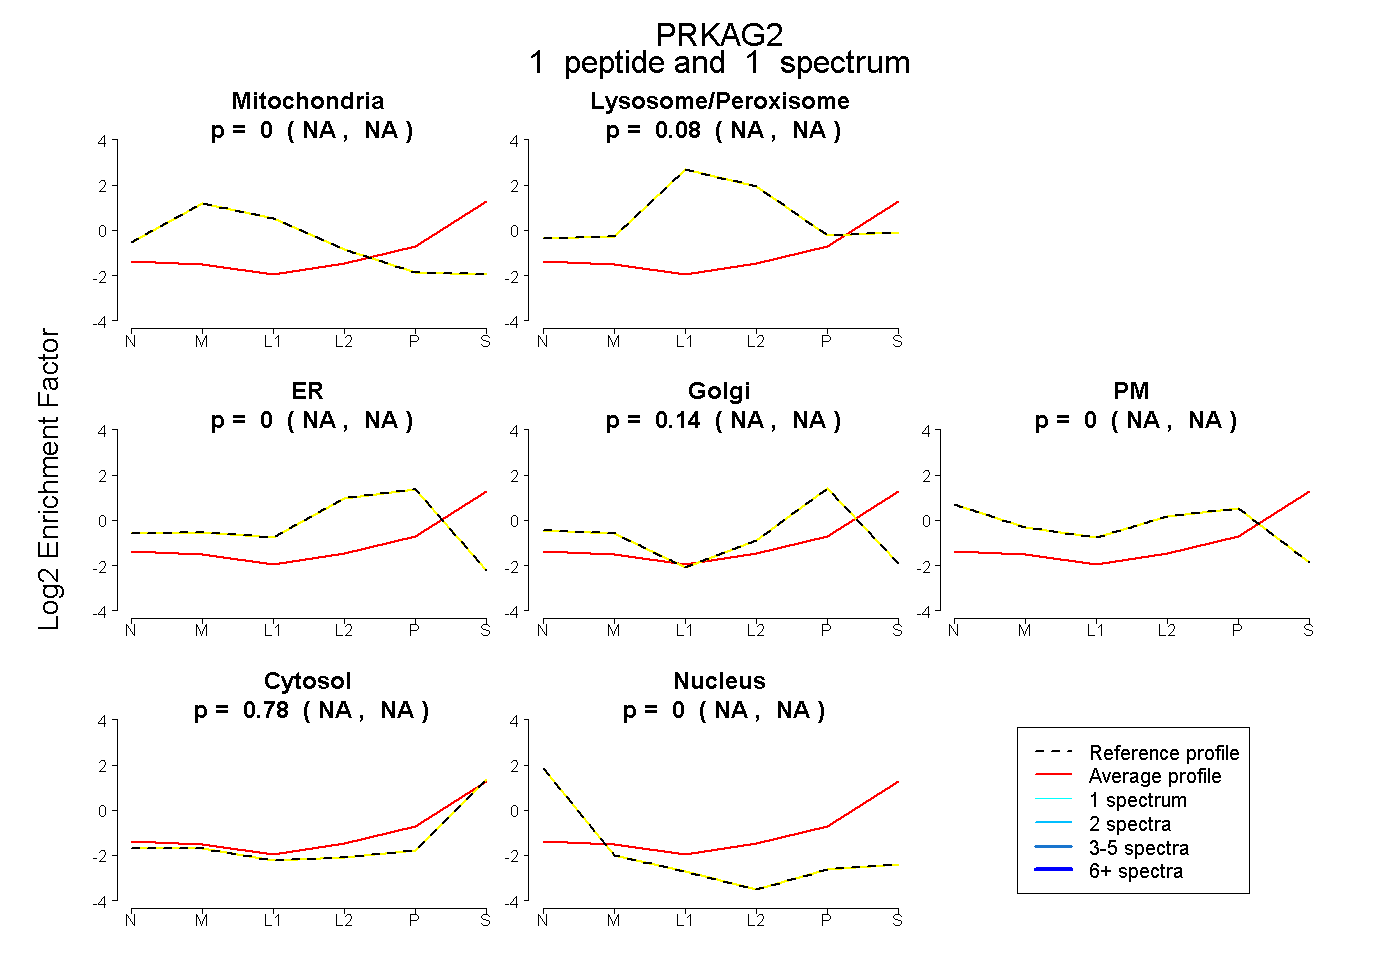
NA | NA
NA | NA
NA | NA
NA | NA
NA | NA
NA | NA
NA | NA
1peptide
spectra
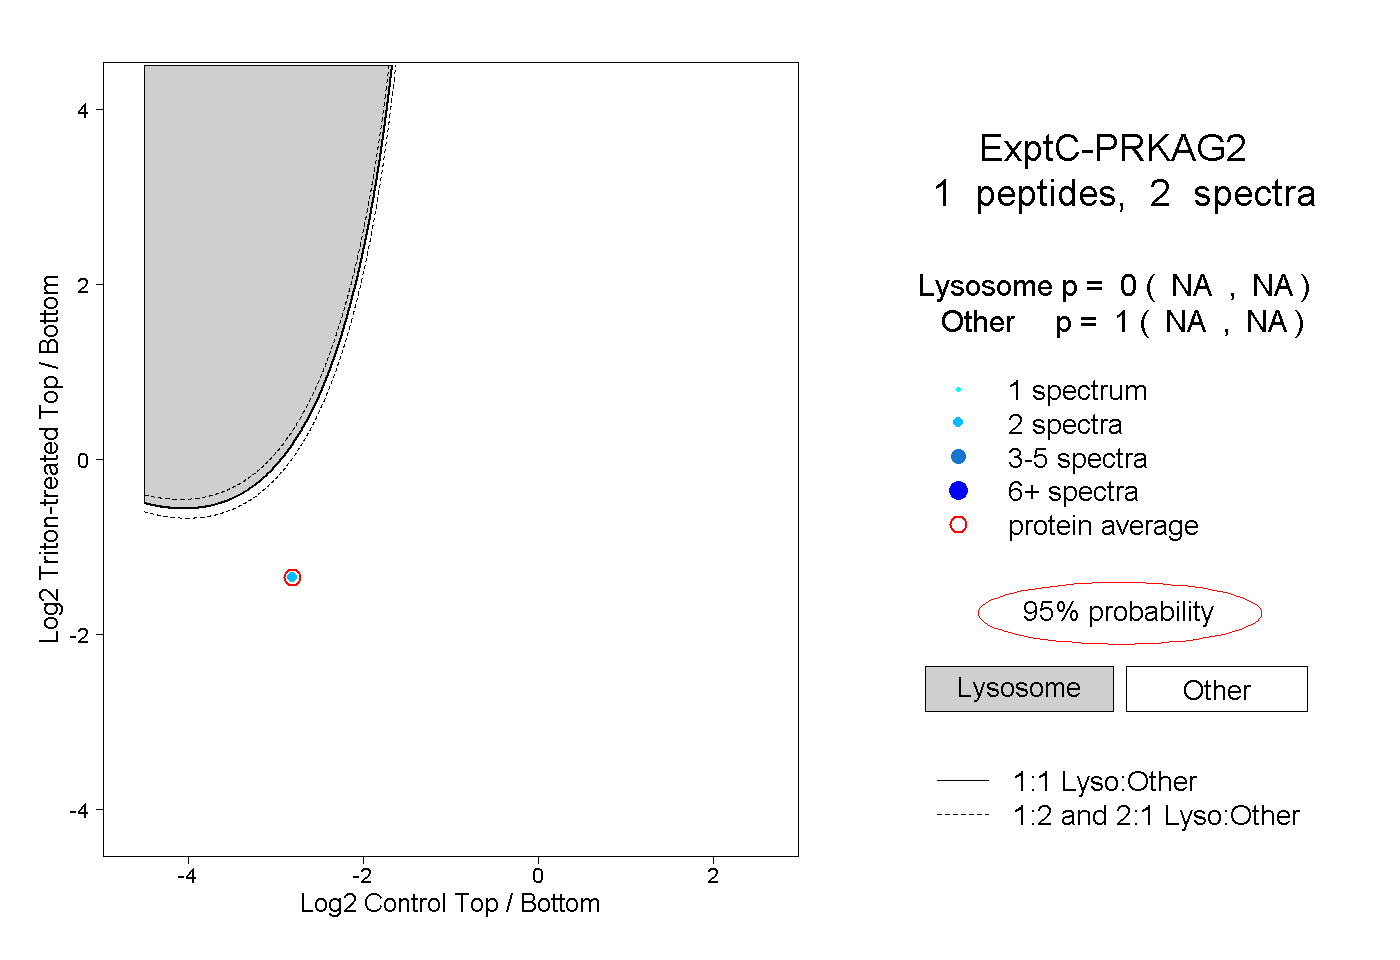
NA | NA
NA | NA
1peptide
spectra
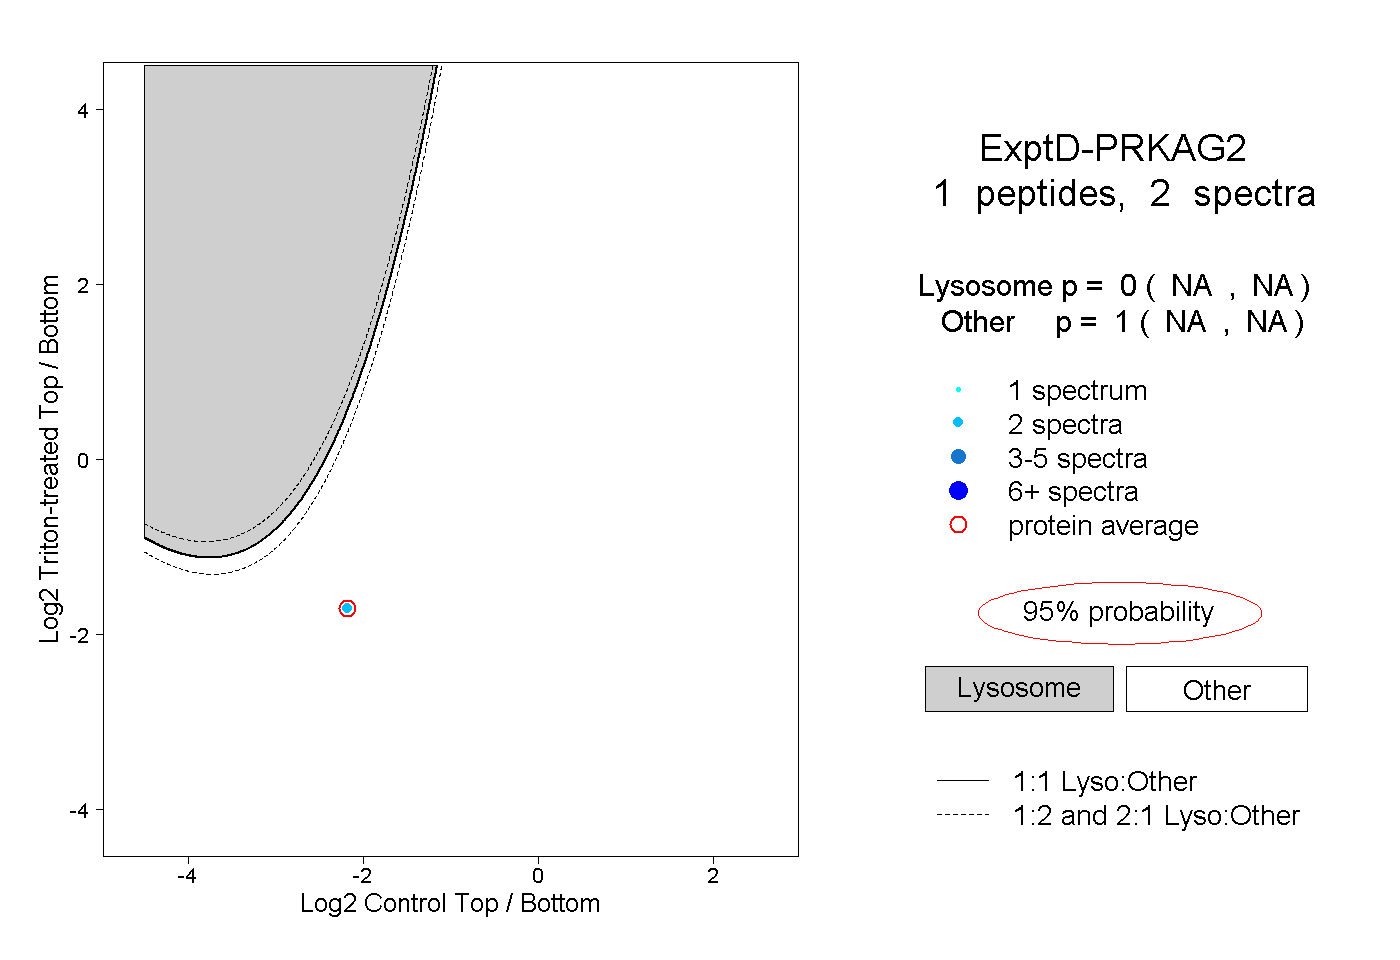
NA | NA
NA | NA