 9
9peptides
spectra
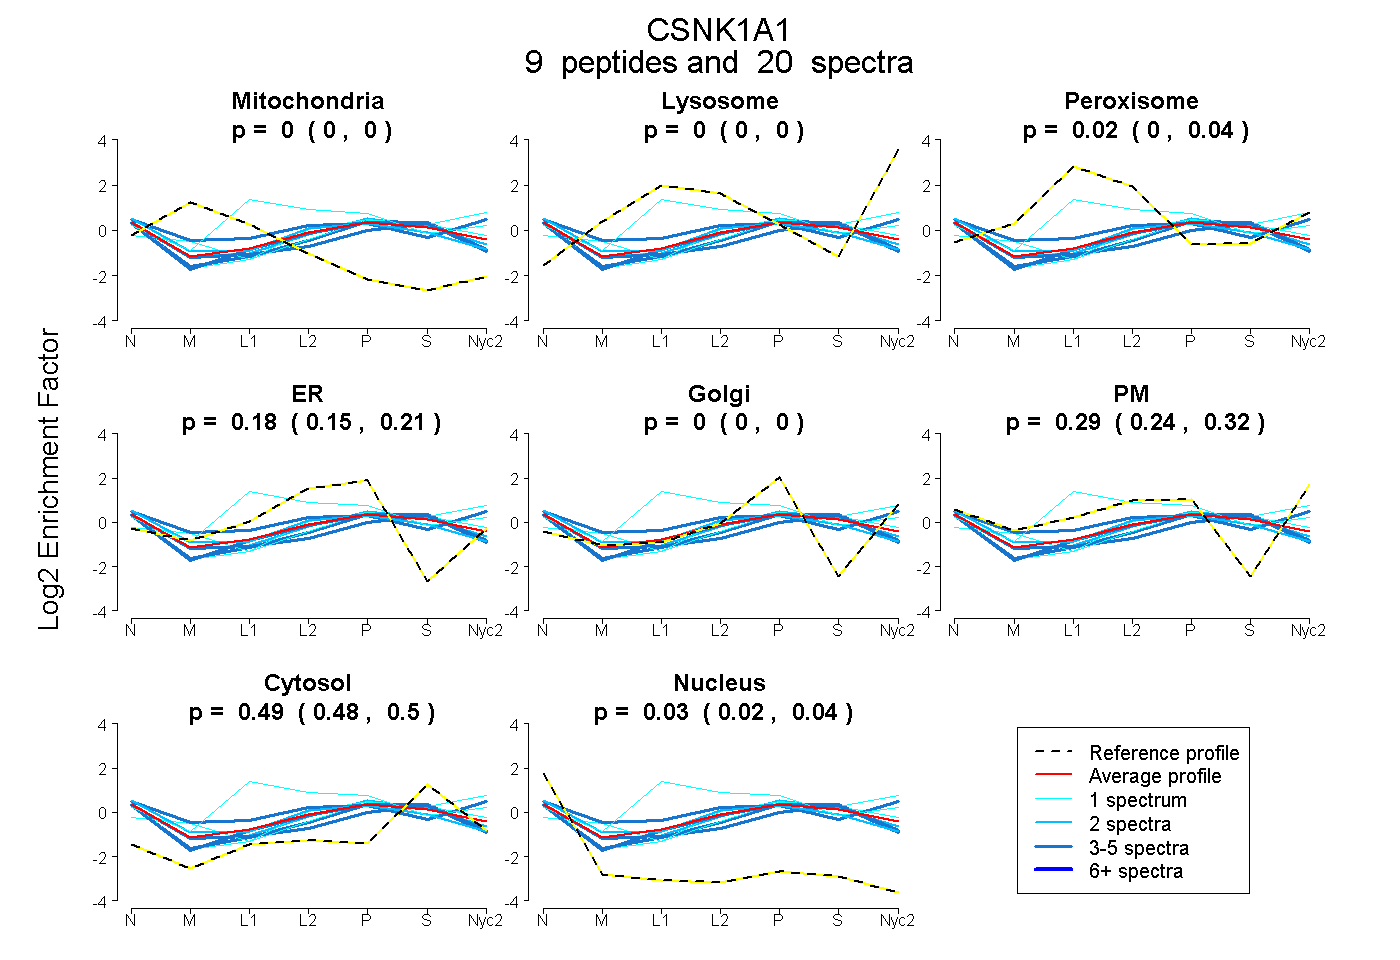
0.000 | 0.000
0.000 | 0.000
0.000 | 0.036
0.148 | 0.205
0.000 | 0.000
0.245 | 0.321
0.476 | 0.500
0.018 | 0.037
3peptides
spectra
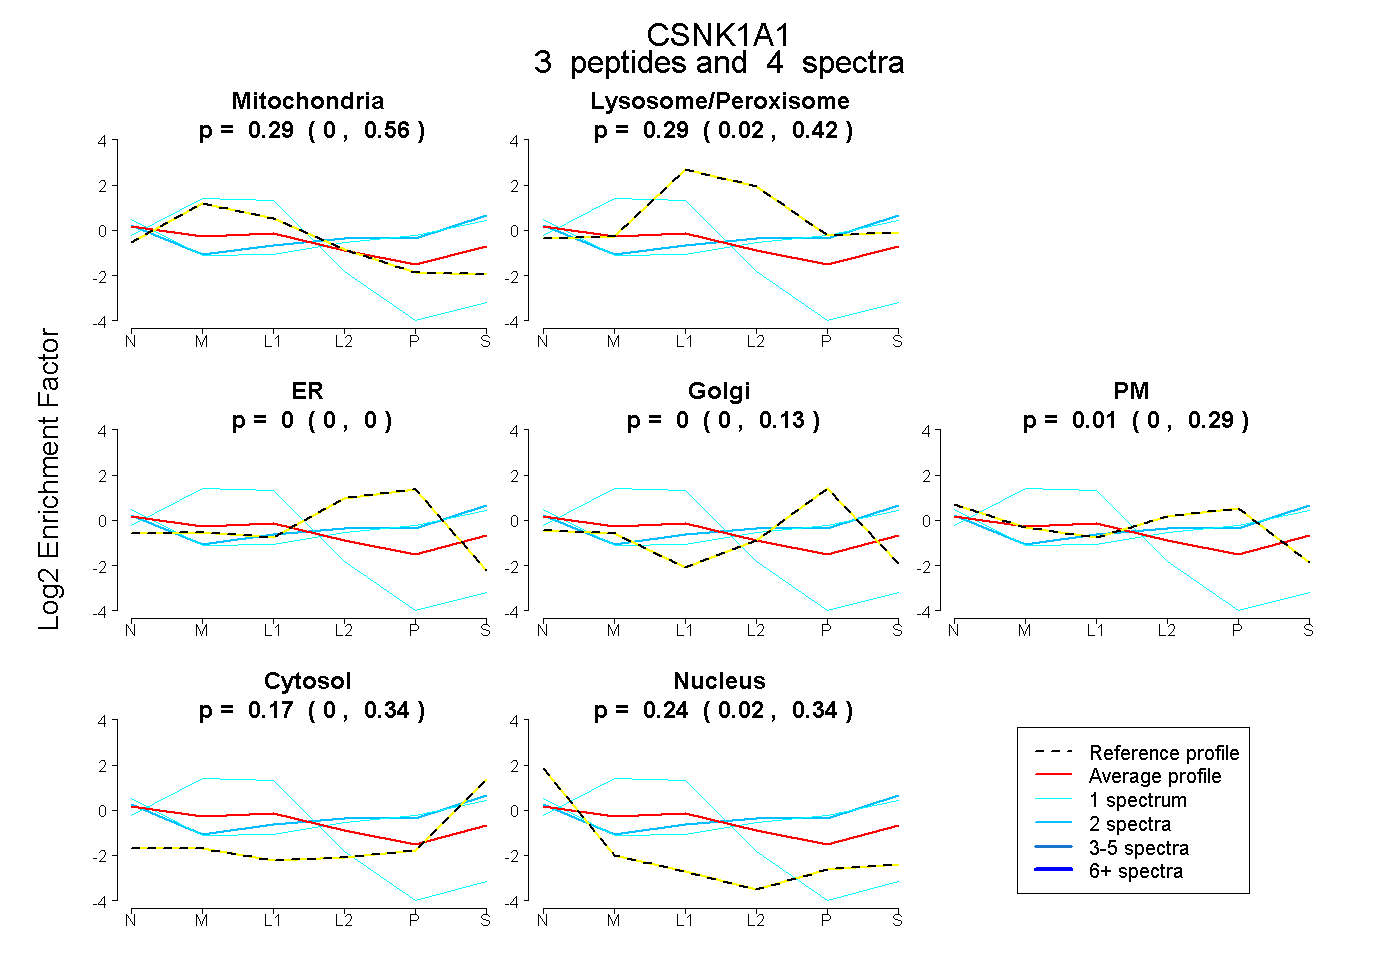
0.000 | 0.560
0.021 | 0.421
0.000 | 0.004
0.000 | 0.131
0.000 | 0.287
0.000 | 0.339
0.020 | 0.338
7peptides
spectra
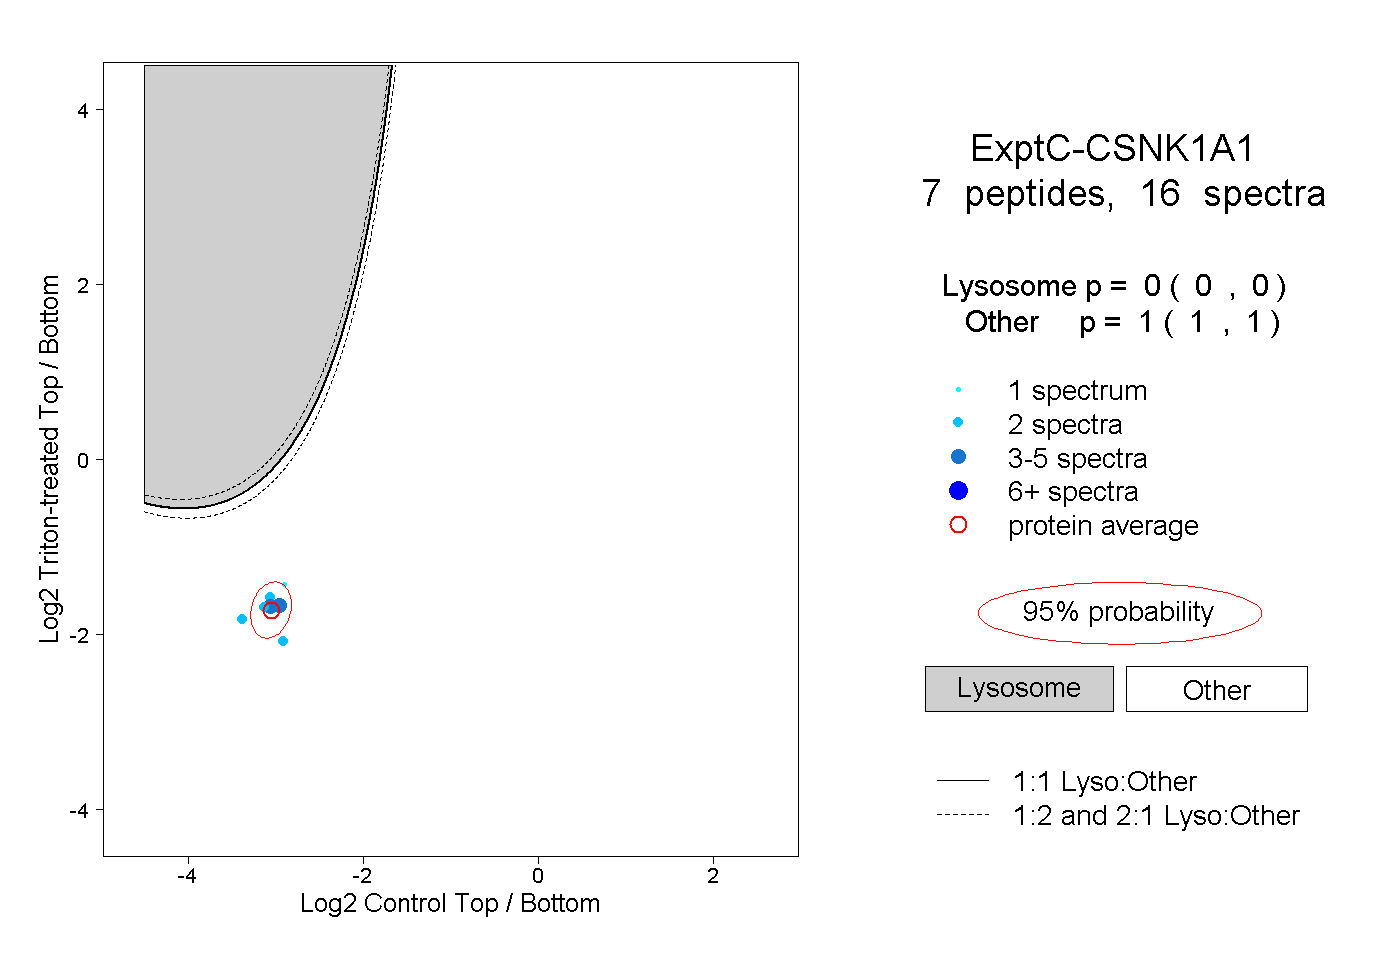
0.000 | 0.000
1.000 | 1.000