 3
3peptides
spectra
0.000 | 0.000
0.727 | 0.820
0.000 | 0.017
0.000 | 0.000
0.000 | 0.000
0.000 | 0.000
0.168 | 0.259
0.000 | 0.000
7peptides
spectra
0.000 | 0.000
1.000 | 1.000
| Plot | Mito | Lyso | Perox | ER | Golgi | PM | Cytosol | Nucleus | |||||
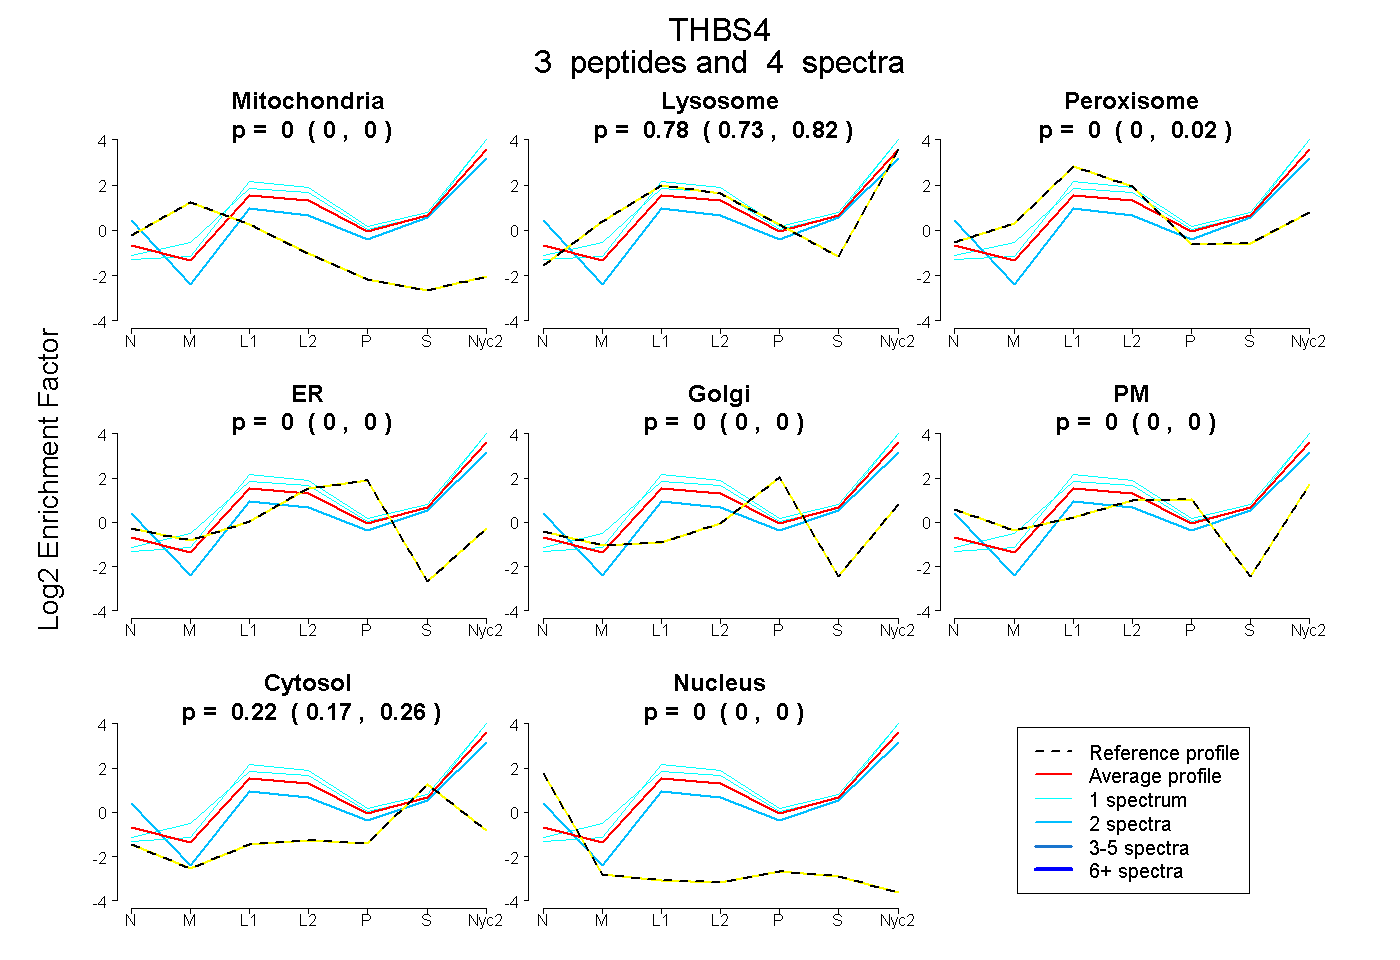
| Expt A |
3 peptides |
4 spectra |
|
0.000 0.000 | 0.000 |
0.780 0.727 | 0.820 |
0.000 0.000 | 0.017 |
0.000 0.000 | 0.000 |
0.000 0.000 | 0.000 |
0.000 0.000 | 0.000 |
0.220 0.168 | 0.259 |
0.000 0.000 | 0.000 |
||
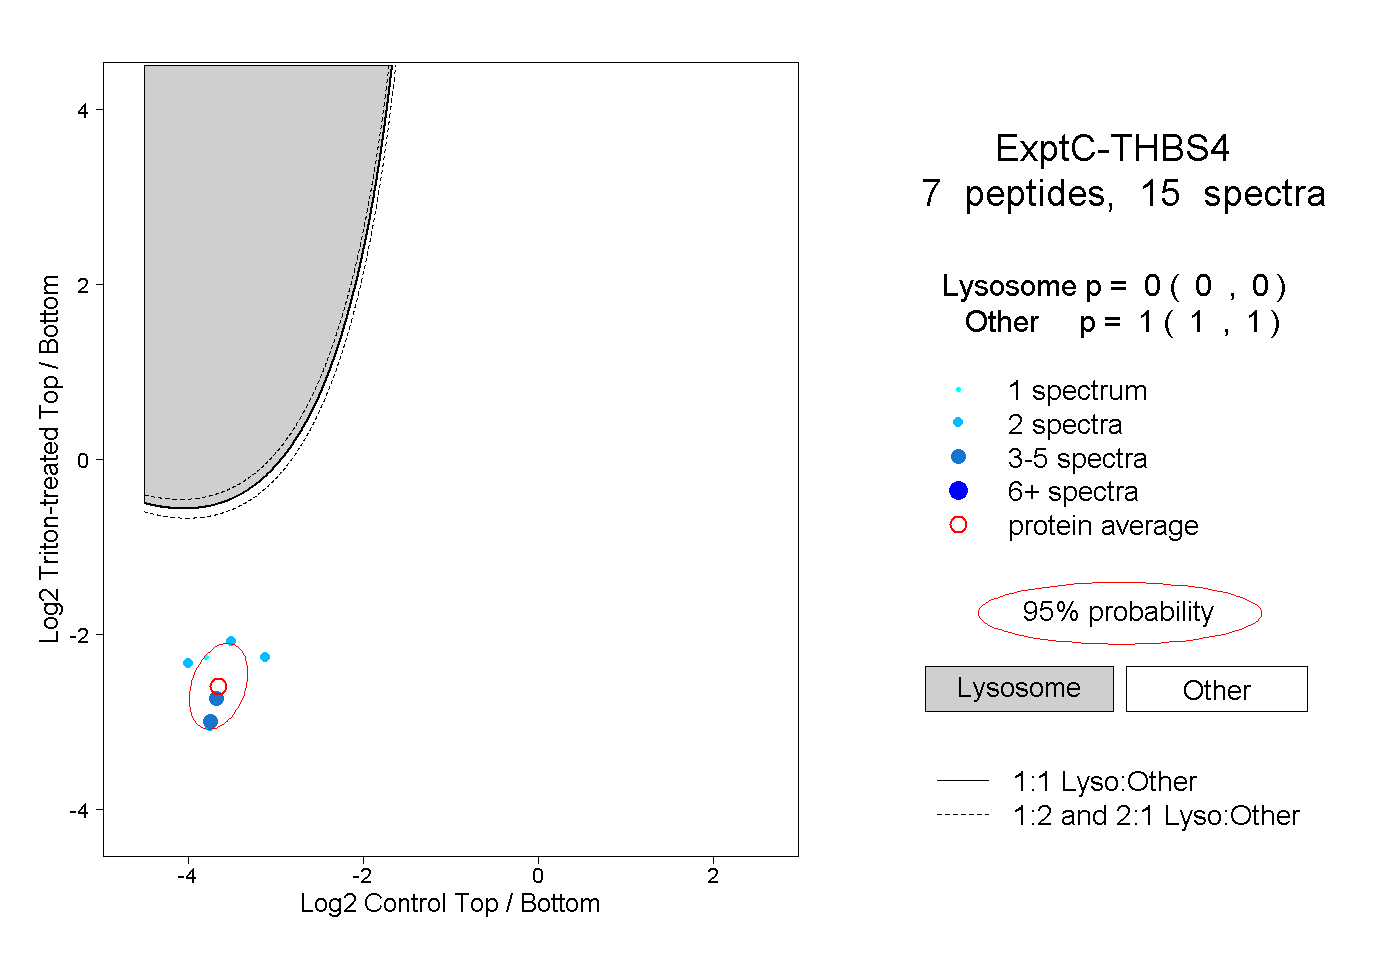
| Plot | Lyso | Other | |||||||||||
| Expt C |
7 peptides |
15 spectra |
|
0.000 0.000 | 0.000 |
1.000 1.000 | 1.000 |
| 3 spectra, CGPCKPGYTGDQTR | 0.000 | 1.000 | ||||||||
| 2 spectra, QVCTDVDECR | 0.000 | 1.000 | ||||||||
| 1 spectrum, NILDNCPR | 0.000 | 1.000 | ||||||||
| 2 spectra, GVLNNDQK | 0.000 | 1.000 | ||||||||
| 2 spectra, ETSFLR | 0.000 | 1.000 | ||||||||
| 3 spectra, TGPGEHLR | 0.000 | 1.000 | ||||||||
| 2 spectra, AVAEPGIQLK | 0.000 | 1.000 |
| Plot | Lyso | Other | |||||||||||
| Expt D |
1 peptide |
1 spectrum |
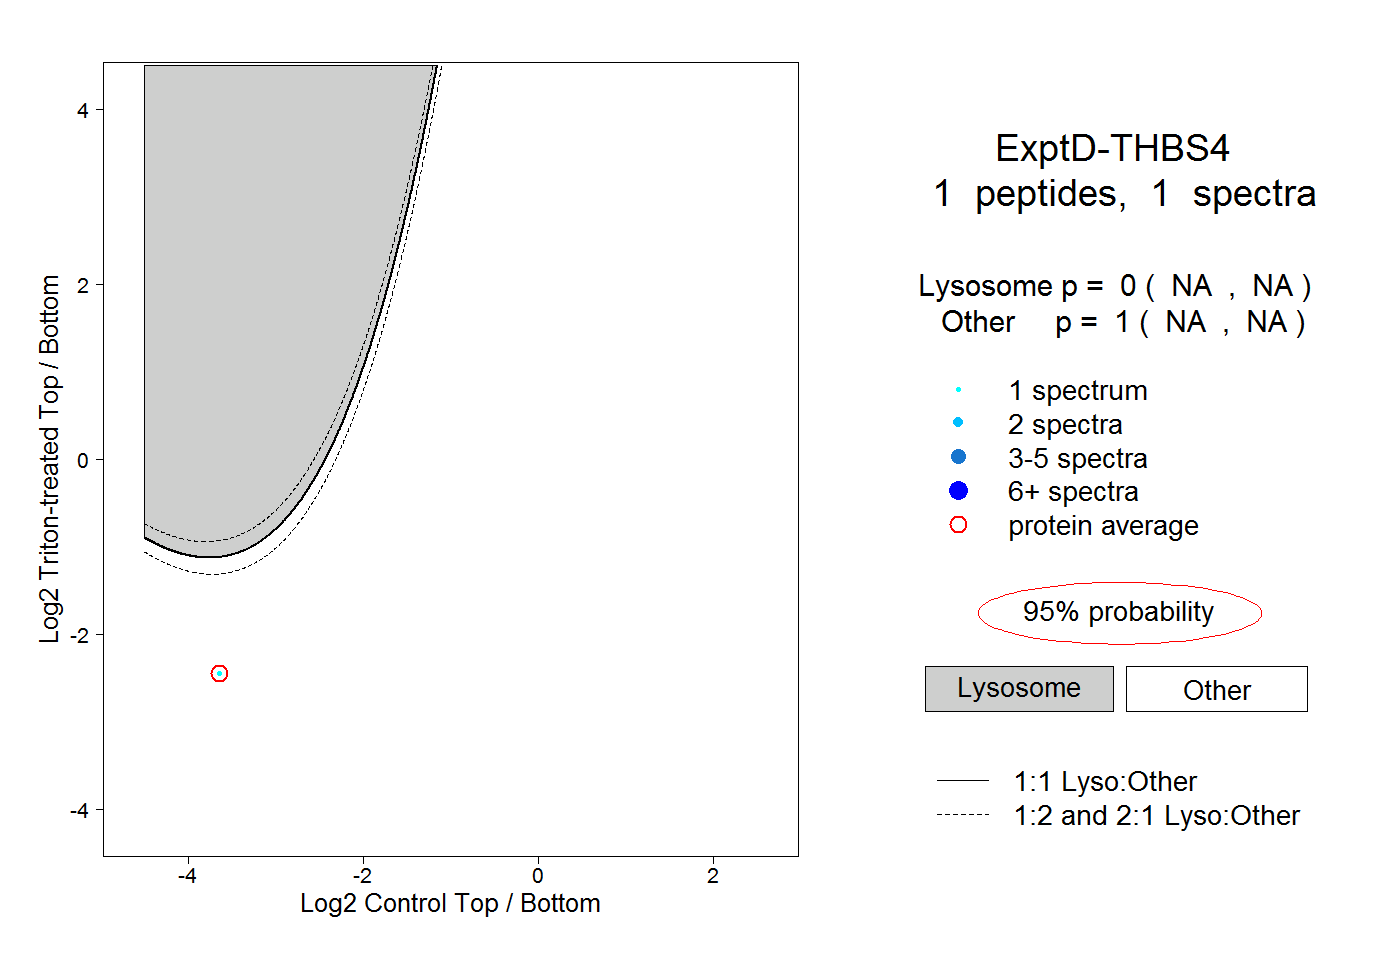 |
0.000 NA | NA |
1.000 NA | NA |