 2
2peptides
spectra
0.000 | 0.000
0.215 | 0.276
0.000 | 0.057
0.000 | 0.003
0.081 | 0.185
0.034 | 0.184
0.455 | 0.487
0.000 | 0.000
2peptides
spectra
0.000 | 0.010
0.990 | 1.000
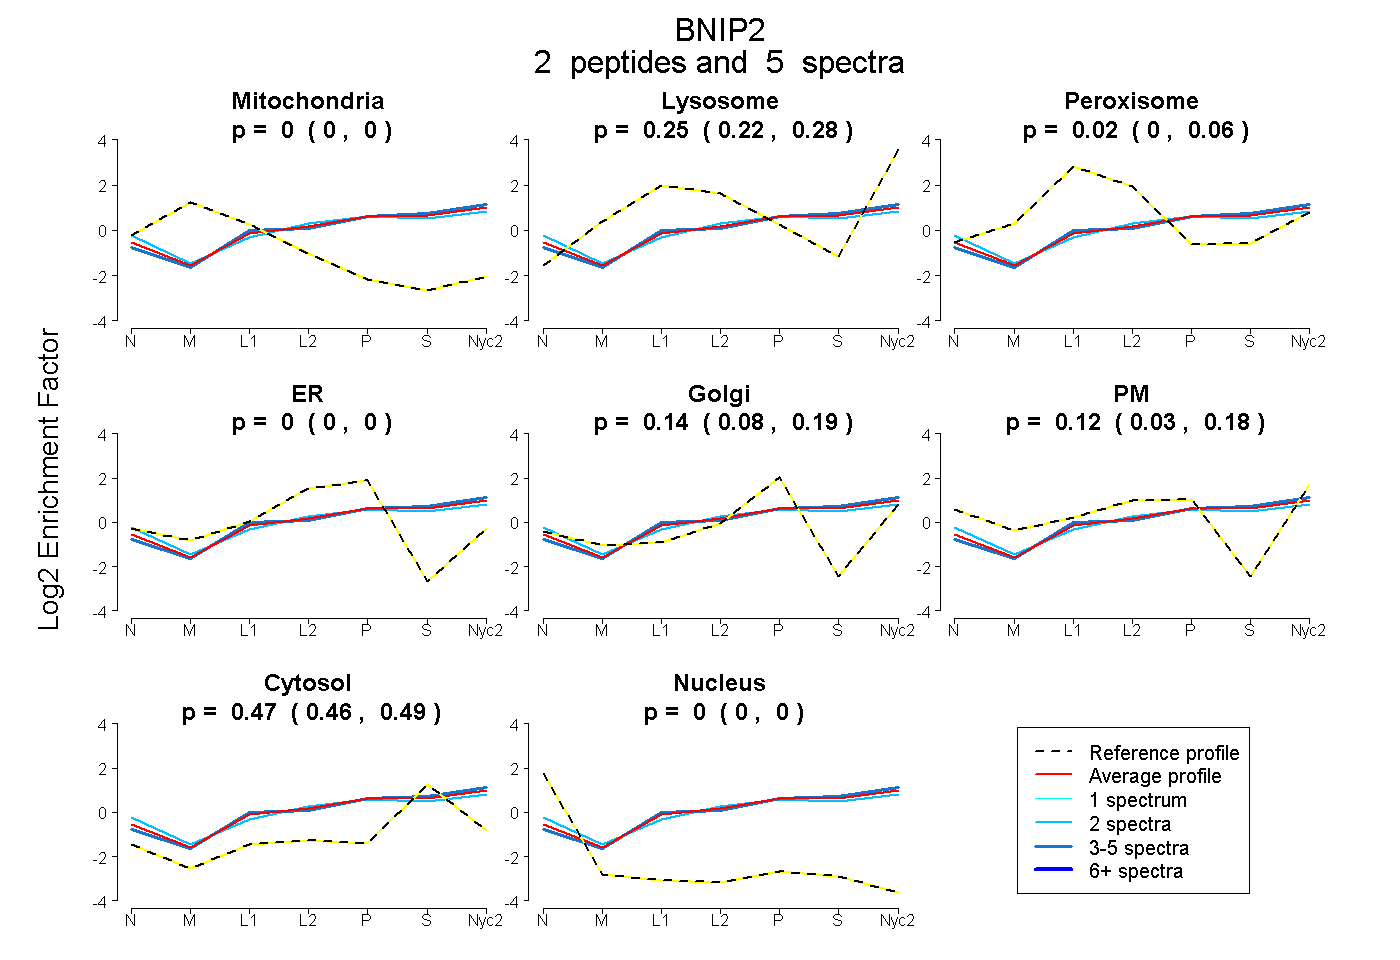
| Plot | Mito | Lyso | Perox | ER | Golgi | PM | Cytosol | Nucleus | |||||
| Expt A |
2 peptides |
5 spectra |
|
0.000 0.000 | 0.000 |
0.248 0.215 | 0.276 |
0.024 0.000 | 0.057 |
0.000 0.000 | 0.003 |
0.138 0.081 | 0.185 |
0.116 0.034 | 0.184 |
0.474 0.455 | 0.487 |
0.000 0.000 | 0.000 |
||
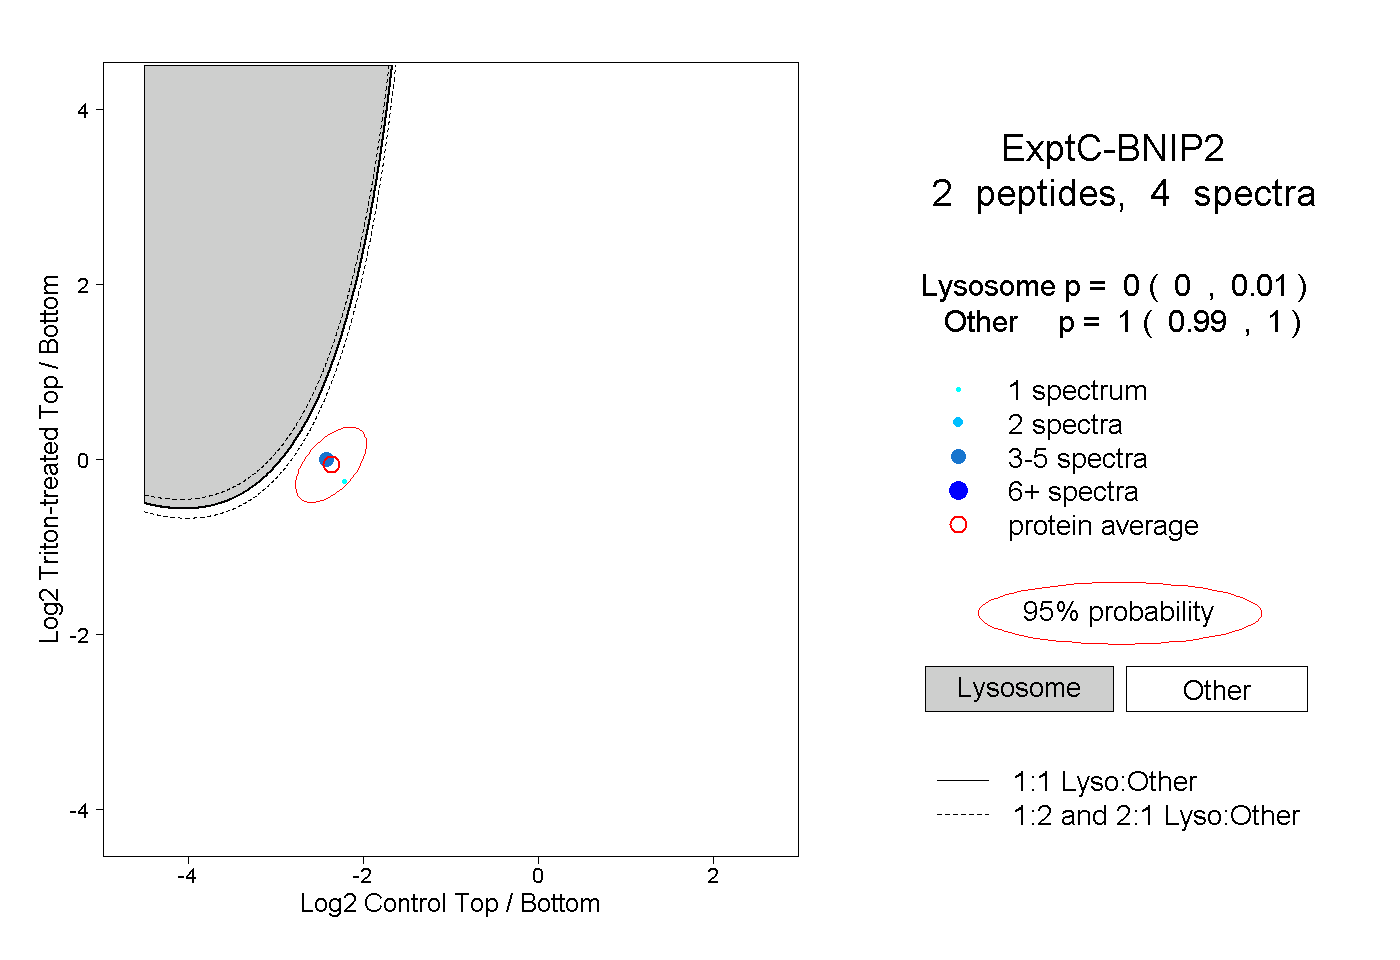
| Plot | Lyso | Other | |||||||||||
| Expt C |
2 peptides |
4 spectra |
|
0.000 0.000 | 0.010 |
1.000 0.990 | 1.000 |