TPR
[ENSRNOP00000062172]
Main page
| | | Plot |
Mito |
Lyso |
|
Perox |
ER |
Golgi |
PM |
Cytosol |
Nucleus |
|
| Expt A |
 35
35
peptides |
62
spectra |
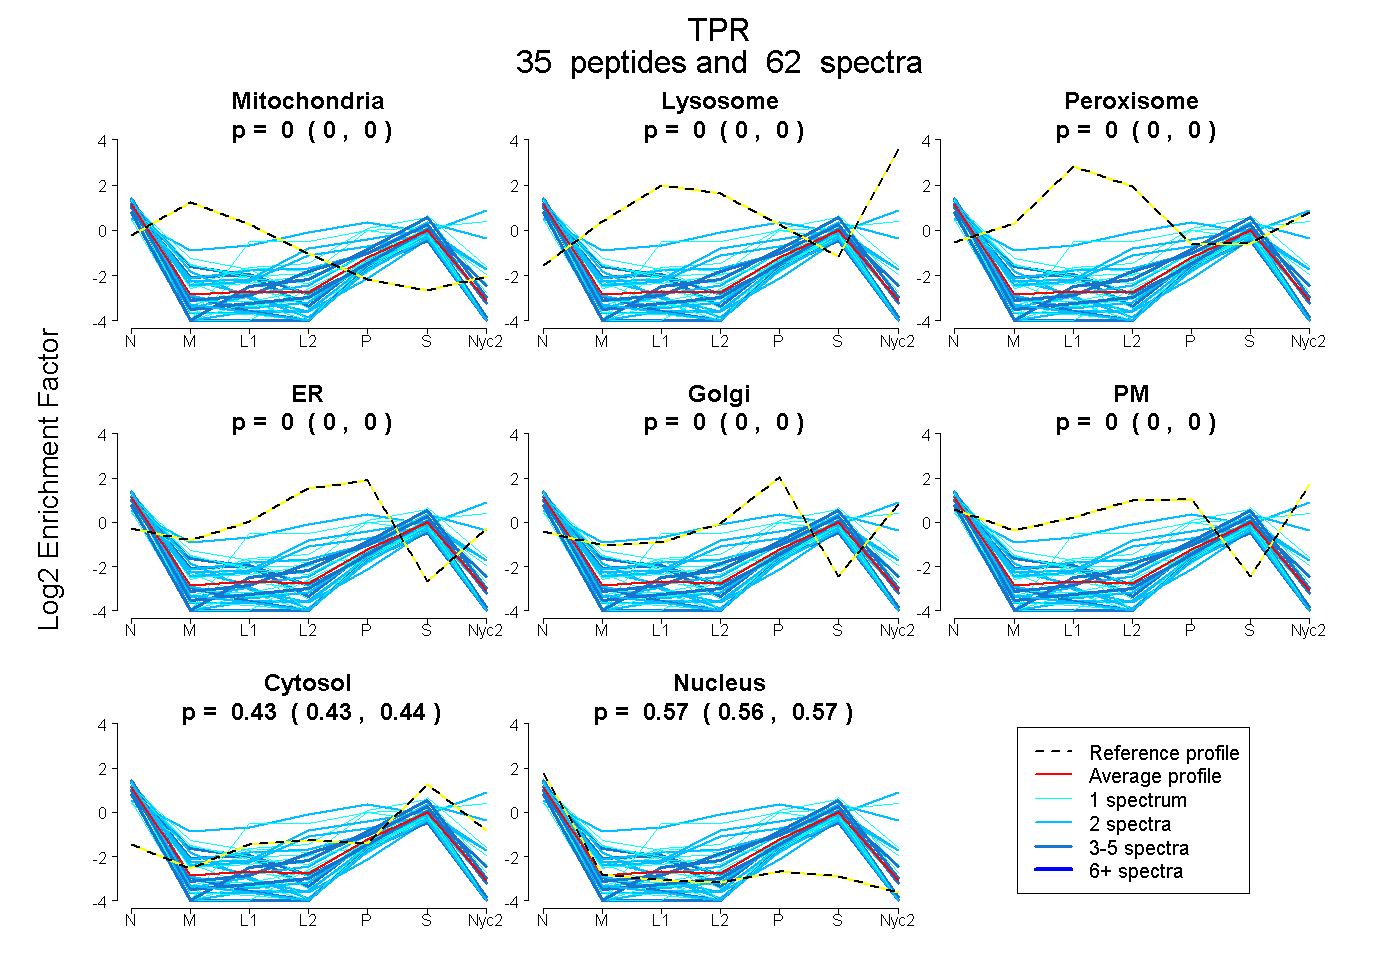 |
0.000
0.000 | 0.000 |
0.000
0.000 | 0.000 |
|
0.000
0.000 | 0.000 |
0.000
0.000 | 0.000 |
0.000
0.000 | 0.000 |
0.000
0.000 | 0.000 |
0.433
0.428 | 0.437 |
0.567
0.563 | 0.571 |
|
| | | Plot |
Mito |
|
Lyso or Perox |
|
ER |
Golgi |
PM |
Cytosol |
Nucleus |
|
| Expt B |
5
peptides |
5
spectra |
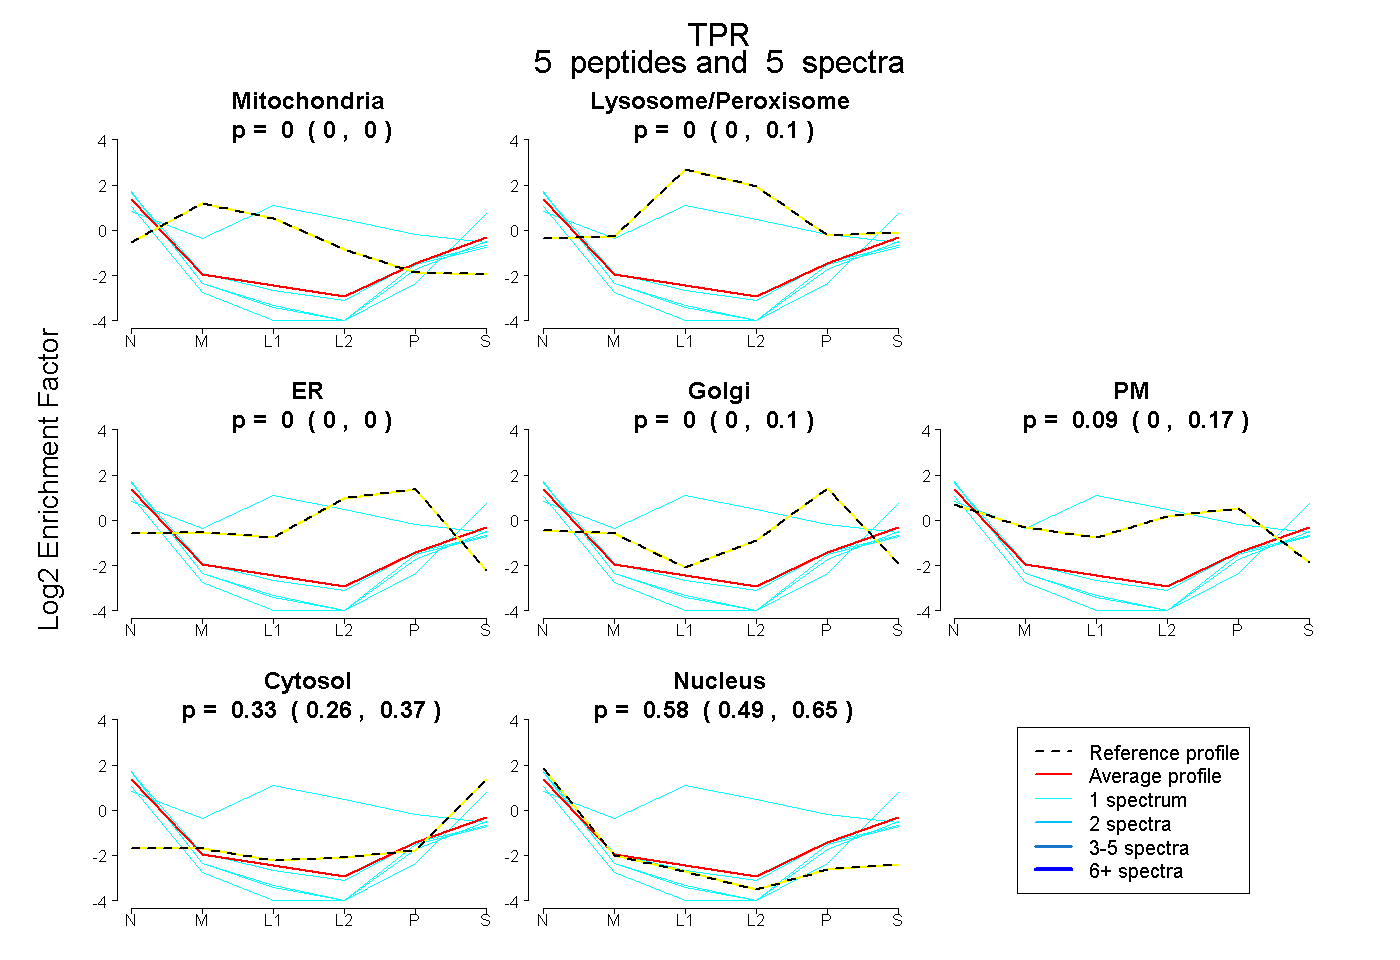 |
0.000
0.000 | 0.000 |
|
0.000
0.000 | 0.097 |
|
0.000
0.000 | 0.000 |
0.000
0.000 | 0.103 |
0.089
0.000 | 0.166 |
0.333
0.255 | 0.367 |
0.578
0.487 | 0.653 |
|
| 1 spectrum, ASTALSNEQQAR |
0.000 |
|
0.000 |
|
0.000 |
0.000 |
0.000 |
0.449 |
0.551 |
|
| 1 spectrum, VLLMELEEAR |
0.000 |
|
0.000 |
|
0.000 |
0.000 |
0.000 |
0.250 |
0.750 |
|
| 1 spectrum, NIEELQQQNQR |
0.000 |
|
0.587 |
|
0.000 |
0.000 |
0.266 |
0.000 |
0.147 |
|
| 1 spectrum, NLGIQSQFTR |
0.000 |
|
0.000 |
|
0.000 |
0.000 |
0.000 |
0.215 |
0.785 |
|
| 1 spectrum, EITSLQER |
0.000 |
|
0.000 |
|
0.000 |
0.079 |
0.018 |
0.234 |
0.669 |
|
| | | Plot |
|
Lyso |
|
|
|
|
|
|
|
Other |
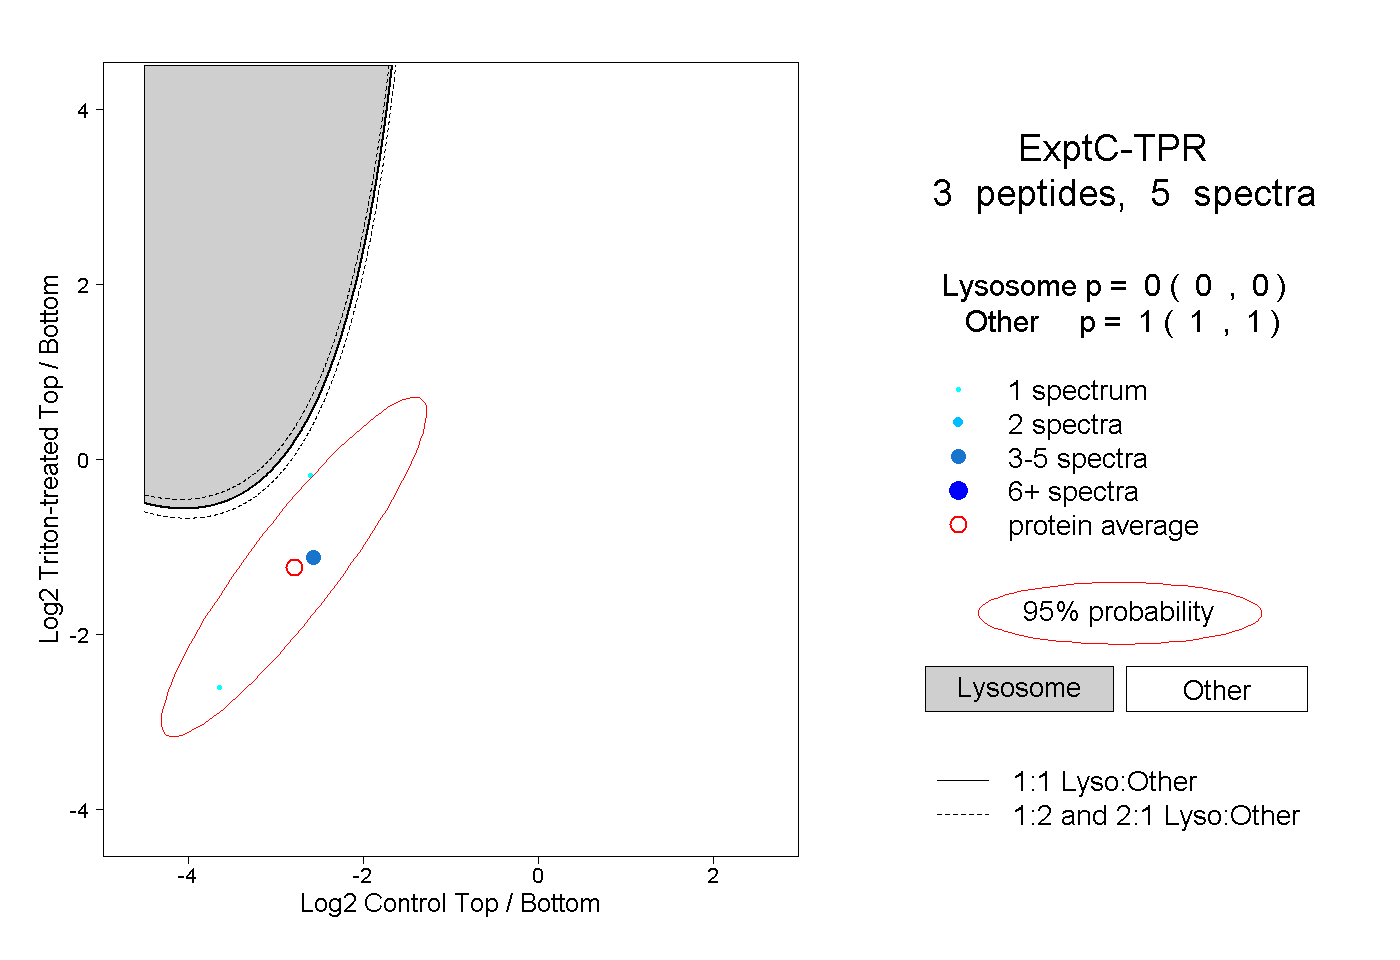
| Expt C |
3
peptides |
5
spectra |
 |
|
0.000
0.000 | 0.000 |
|
|
|
|
|
|
|
1.000
1.000 | 1.000 |