13
13peptides
spectra
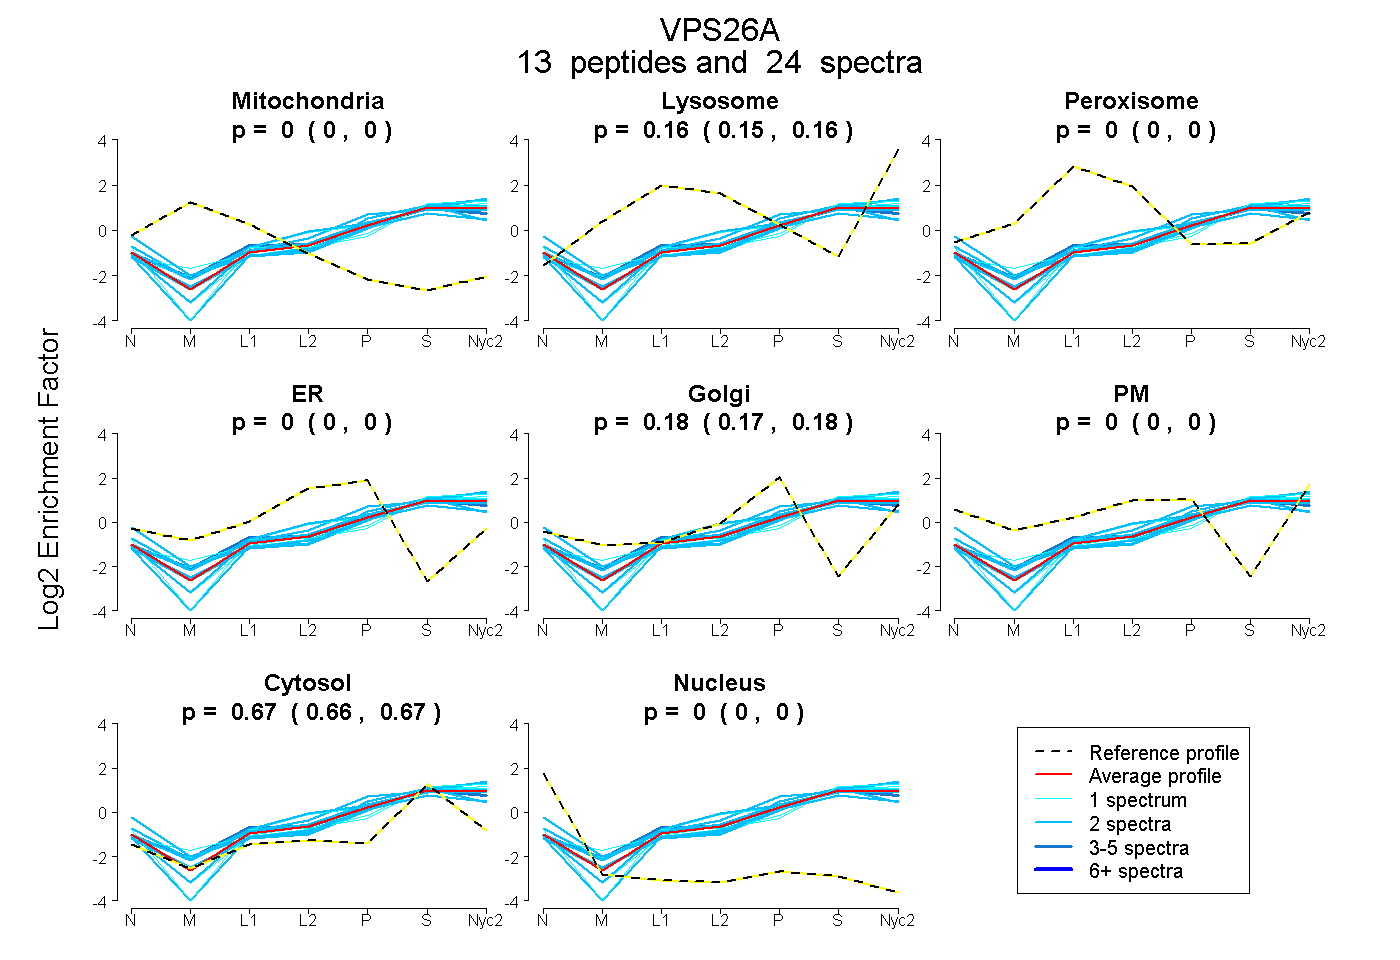
0.000 | 0.000
0.147 | 0.161
0.000 | 0.000
0.000 | 0.000
0.170 | 0.181
0.000 | 0.000
0.664 | 0.674
0.000 | 0.000
5peptides
spectra
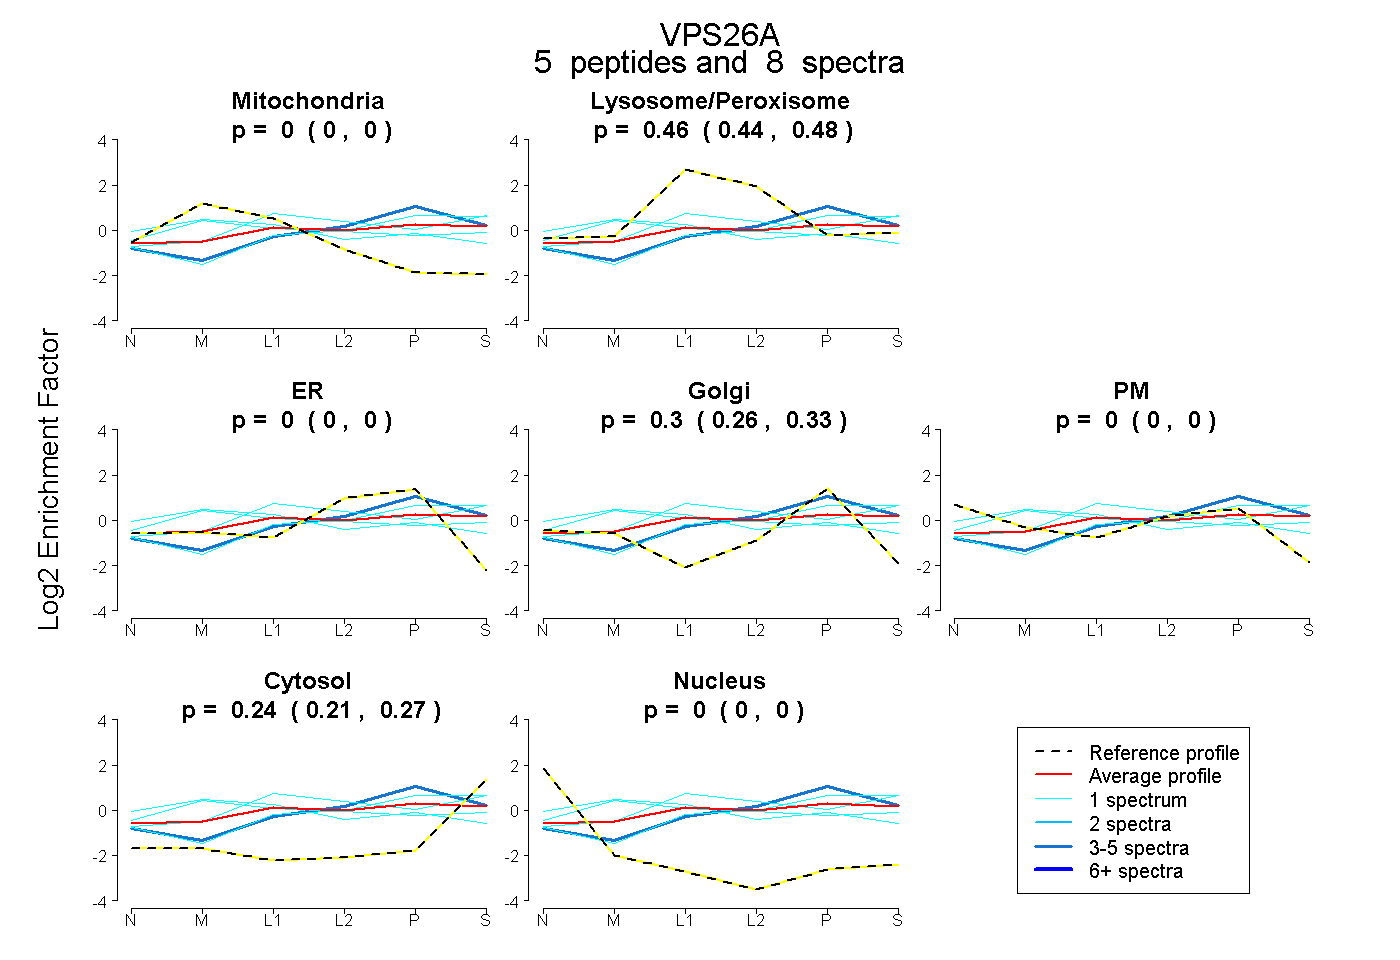
0.000 | 0.000
0.442 | 0.479
0.000 | 0.000
0.257 | 0.328
0.000 | 0.000
0.208 | 0.270
0.000 | 0.000
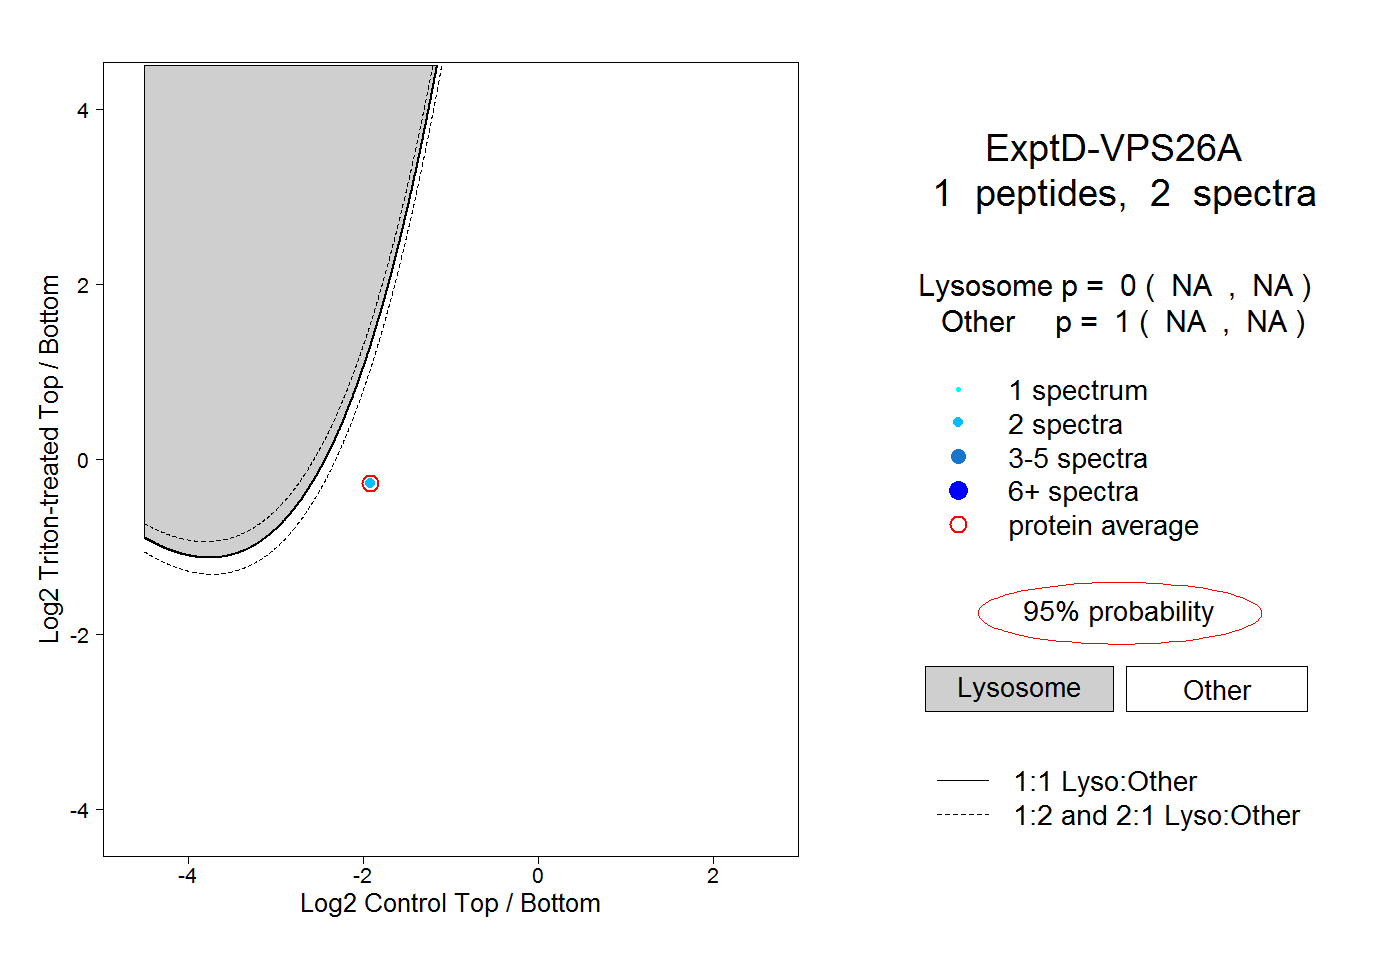
13peptides
spectra
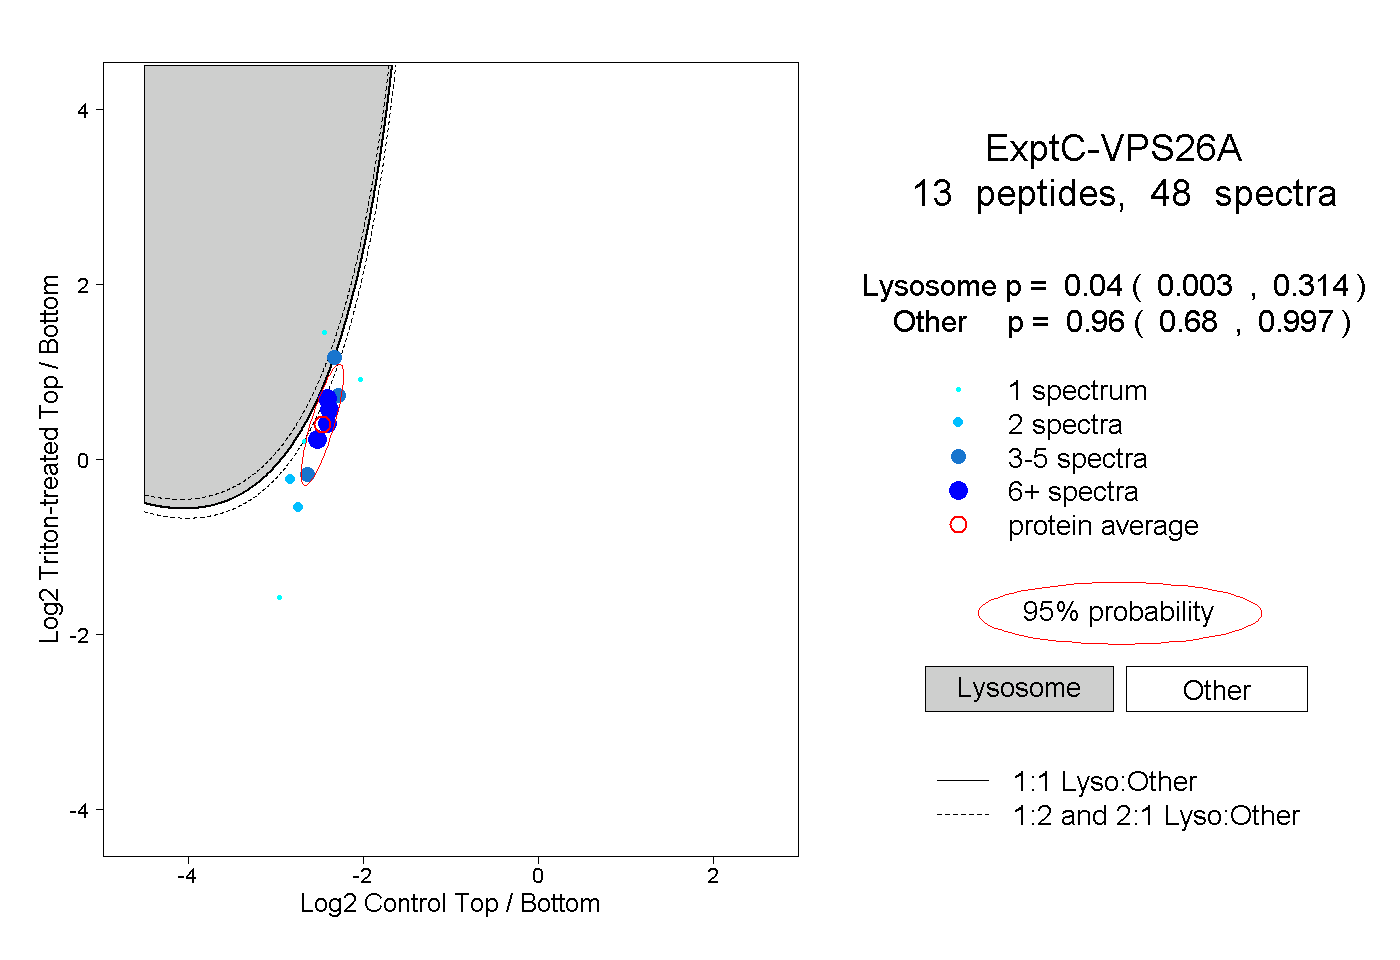
0.003 | 0.314
0.680 | 0.997