 13
13peptides
spectra
0.000 | 0.000
0.147 | 0.161
0.000 | 0.000
0.000 | 0.000
0.170 | 0.181
0.000 | 0.000
0.664 | 0.674
0.000 | 0.000
| Plot | Mito | Lyso | Perox | ER | Golgi | PM | Cytosol | Nucleus | |||||
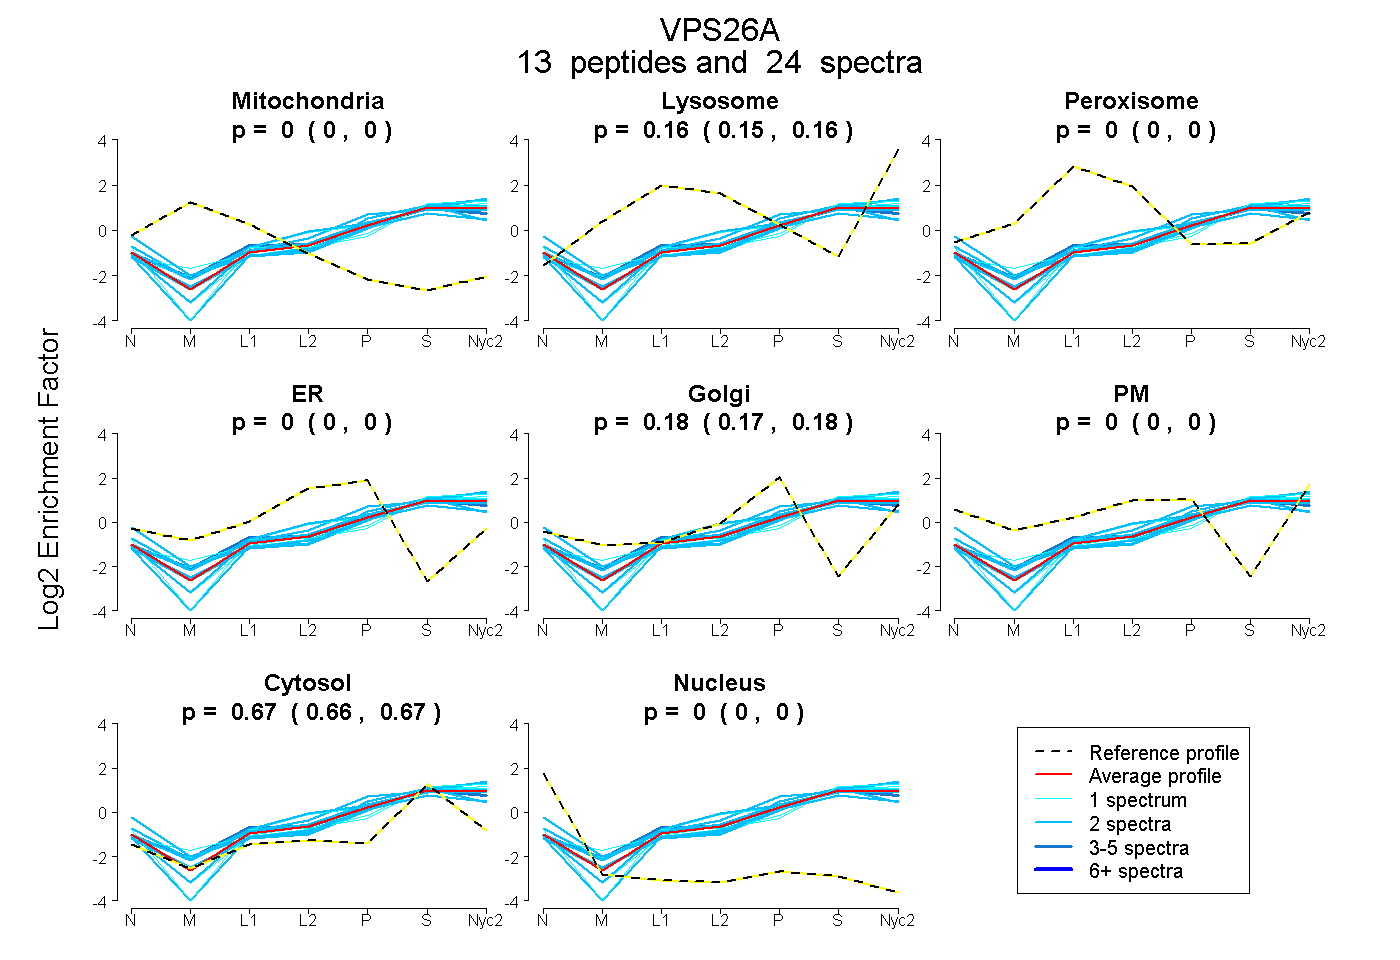
| Expt A |
13 peptides |
24 spectra |
|
0.000 0.000 | 0.000 |
0.155 0.147 | 0.161 |
0.000 0.000 | 0.000 |
0.000 0.000 | 0.000 |
0.176 0.170 | 0.181 |
0.000 0.000 | 0.000 |
0.669 0.664 | 0.674 |
0.000 0.000 | 0.000 |
| 2 spectra, GESIPIR | 0.000 | 0.167 | 0.000 | 0.000 | 0.232 | 0.000 | 0.601 | 0.000 | ||
| 2 spectra, FESPESQASAEQPEM | 0.000 | 0.000 | 0.000 | 0.000 | 0.239 | 0.000 | 0.761 | 0.000 | ||
| 2 spectra, VNLAFK | 0.000 | 0.000 | 0.000 | 0.000 | 0.122 | 0.222 | 0.656 | 0.000 | ||
| 2 spectra, LEHQGIR | 0.000 | 0.197 | 0.000 | 0.000 | 0.166 | 0.041 | 0.596 | 0.000 | ||
| 1 spectrum, HYLFYDGESVSGK | 0.000 | 0.272 | 0.000 | 0.000 | 0.115 | 0.000 | 0.613 | 0.000 | ||
| 2 spectra, YEIMDGAPVK | 0.000 | 0.186 | 0.000 | 0.000 | 0.196 | 0.000 | 0.618 | 0.000 | ||
| 2 spectra, QQEIILWR | 0.000 | 0.145 | 0.000 | 0.000 | 0.151 | 0.000 | 0.704 | 0.000 | ||
| 2 spectra, IYFLLVR | 0.000 | 0.184 | 0.000 | 0.000 | 0.135 | 0.000 | 0.681 | 0.000 | ||
| 1 spectrum, EITGIGPSTTTETETIAK | 0.000 | 0.121 | 0.000 | 0.000 | 0.119 | 0.000 | 0.760 | 0.000 | ||
| 1 spectrum, SYDFEFMQVEKPYESYIGANVR | 0.000 | 0.149 | 0.000 | 0.000 | 0.072 | 0.000 | 0.780 | 0.000 | ||
| 1 spectrum, LTDLVK | 0.000 | 0.228 | 0.000 | 0.000 | 0.130 | 0.000 | 0.642 | 0.000 | ||
| 2 spectra, DVIVGK | 0.000 | 0.141 | 0.000 | 0.000 | 0.151 | 0.000 | 0.708 | 0.000 | ||
| 4 spectra, ELALPGELTQSR | 0.000 | 0.196 | 0.000 | 0.000 | 0.158 | 0.000 | 0.646 | 0.000 |
| Plot | Mito | Lyso or Perox | ER | Golgi | PM | Cytosol | Nucleus | ||||||
| Expt B |
5 peptides |
8 spectra |
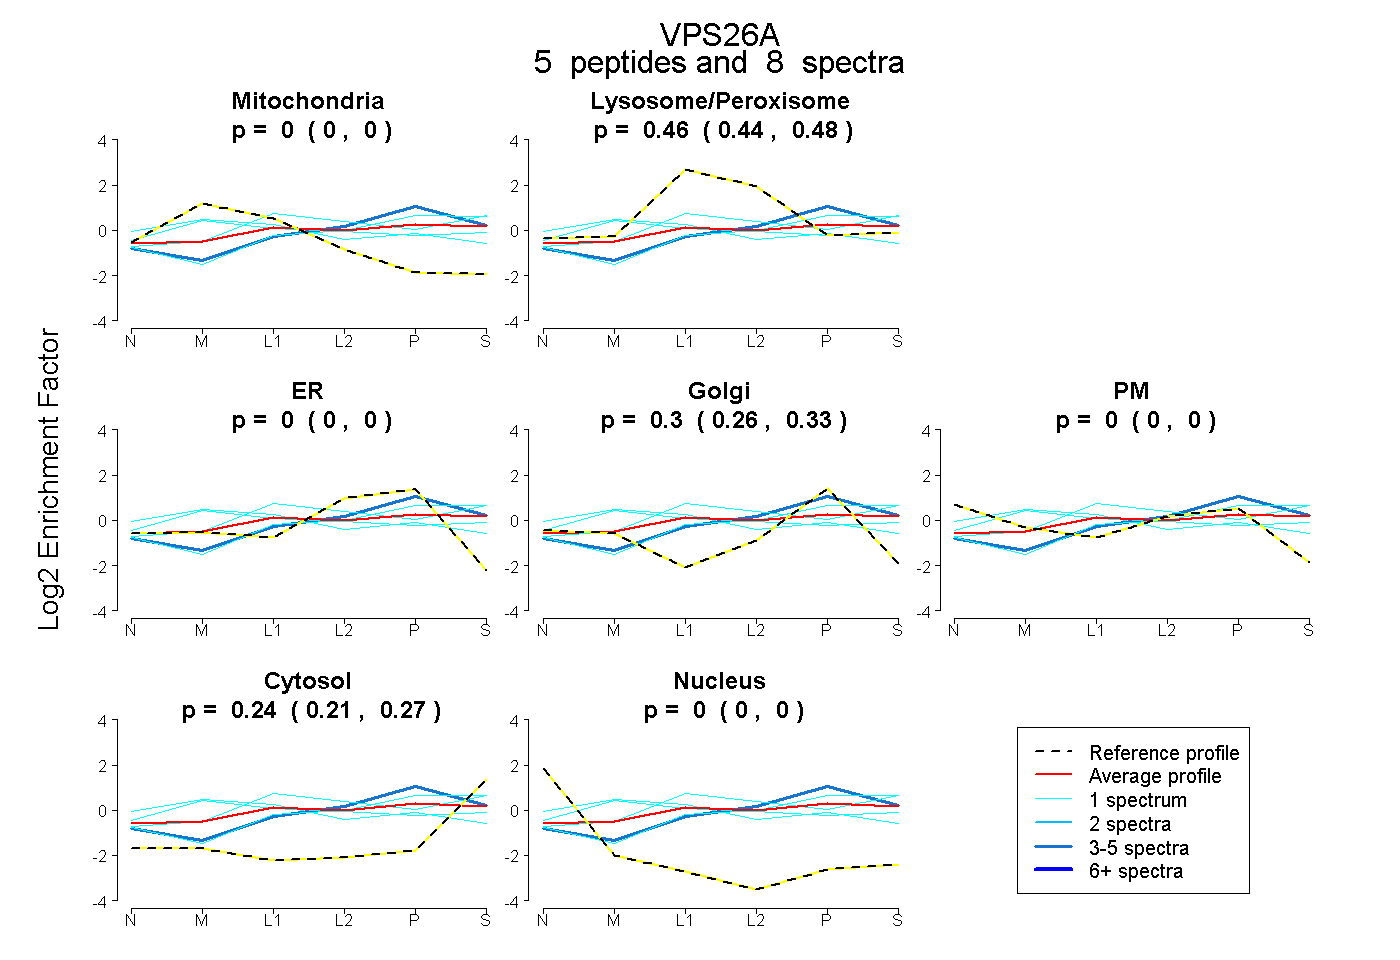 |
0.000 0.000 | 0.000 |
0.462 0.442 | 0.479 |
0.000 0.000 | 0.000 |
0.297 0.257 | 0.328 |
0.000 0.000 | 0.000 |
0.241 0.208 | 0.270 |
0.000 0.000 | 0.000 |
|||
| Plot | Lyso | Other | |||||||||||
| Expt C |
13 peptides |
48 spectra |
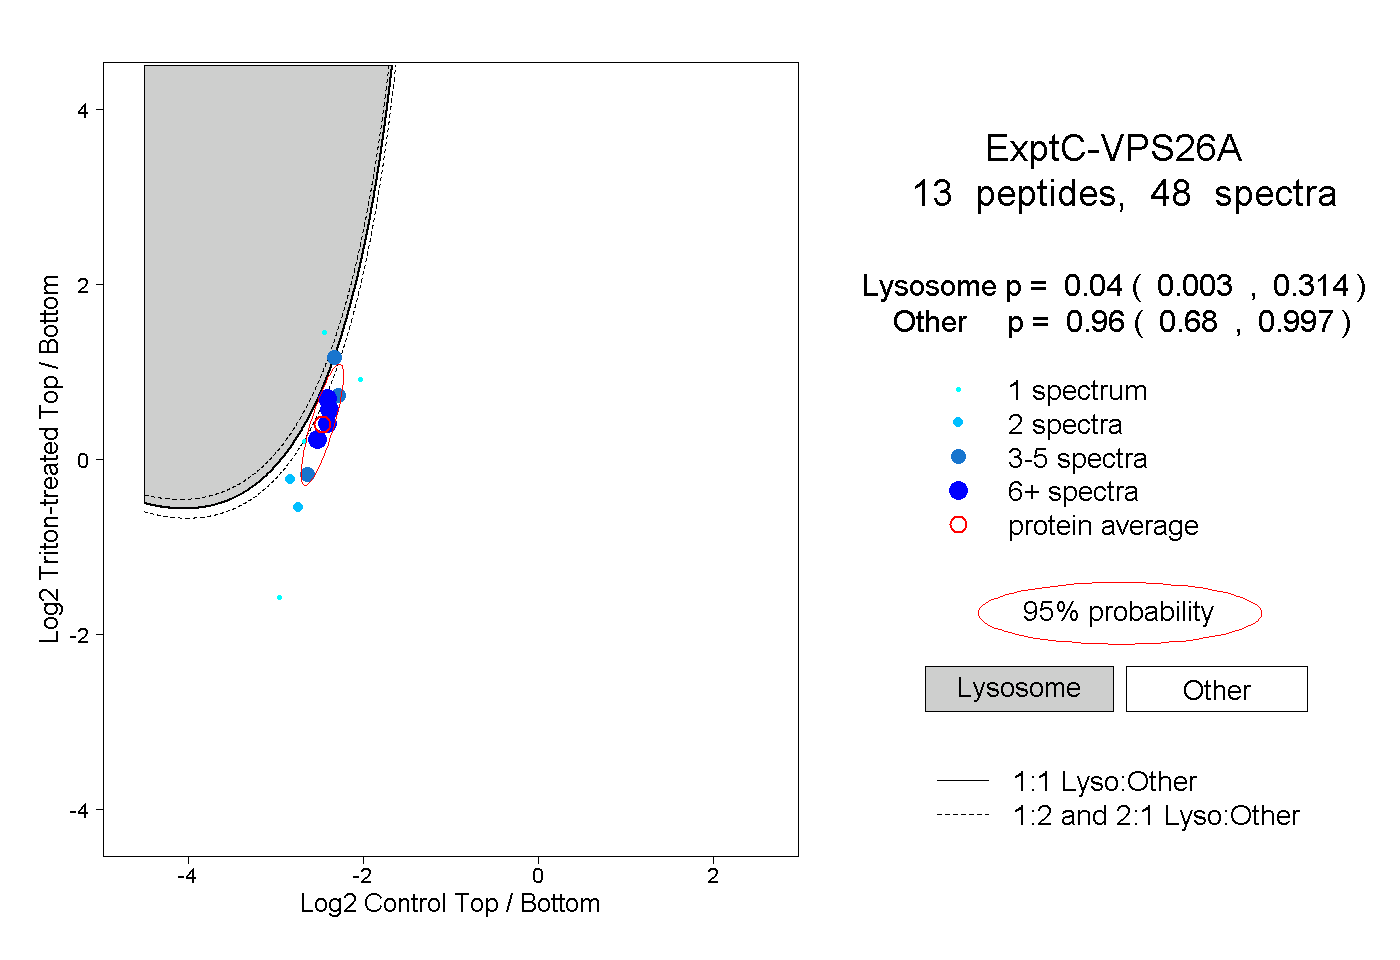 |
0.040 0.003 | 0.314 |
0.960 0.680 | 0.997 |
||||||||
| Plot | Lyso | Other | |||||||||||
| Expt D |
1 peptide |
2 spectra |
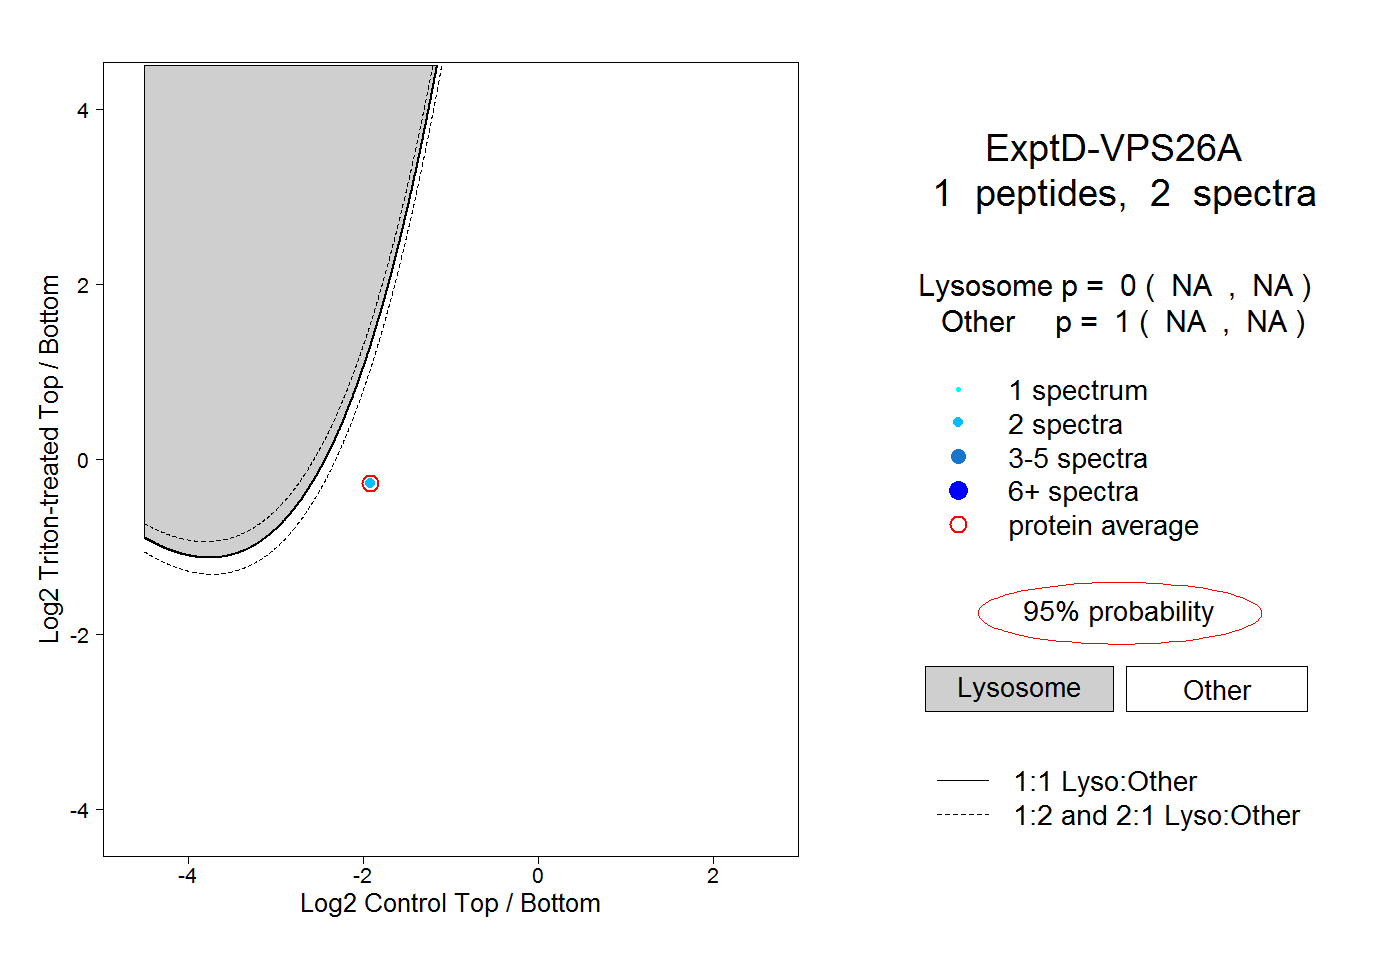 |
0.000 NA | NA |
1.000 NA | NA |