 3
3peptides
spectra
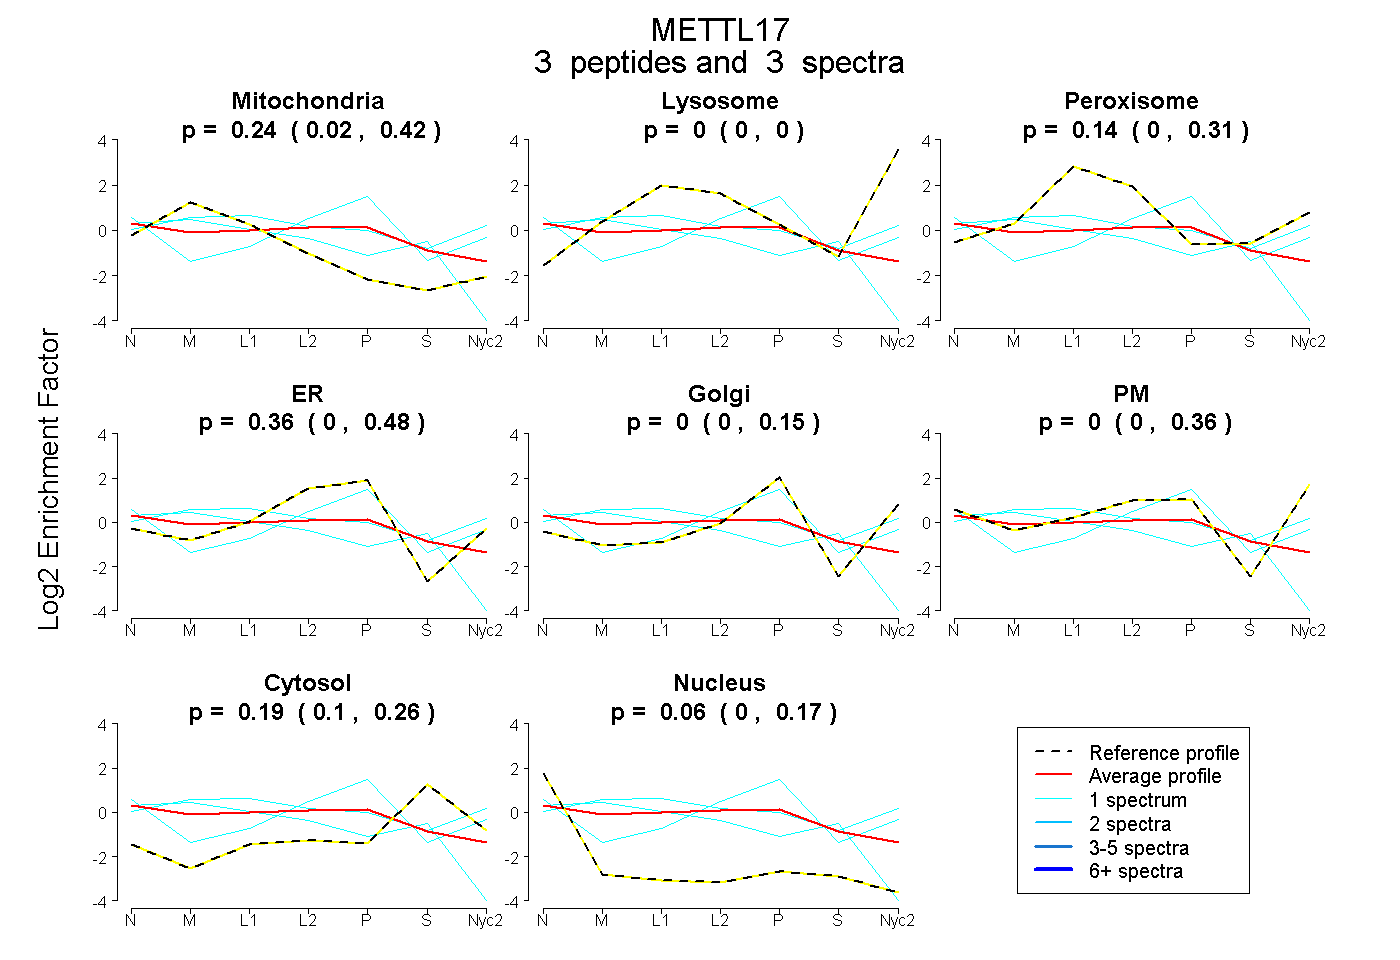
0.022 | 0.424
0.000 | 0.000
0.000 | 0.306
0.000 | 0.476
0.000 | 0.150
0.000 | 0.361
0.100 | 0.257
0.000 | 0.172
| Plot | Mito | Lyso | Perox | ER | Golgi | PM | Cytosol | Nucleus | |||||
| Expt A |
3 peptides |
3 spectra |
|
0.243 0.022 | 0.424 |
0.000 0.000 | 0.000 |
0.143 0.000 | 0.306 |
0.359 0.000 | 0.476 |
0.000 0.000 | 0.150 |
0.000 0.000 | 0.361 |
0.194 0.100 | 0.257 |
0.061 0.000 | 0.172 |
| 1 spectrum, EYVCVDR | 0.221 | 0.000 | 0.333 | 0.000 | 0.122 | 0.208 | 0.117 | 0.000 | ||
| 1 spectrum, EAVLHALR | 0.663 | 0.000 | 0.008 | 0.049 | 0.000 | 0.000 | 0.216 | 0.064 | ||
| 1 spectrum, AFHEIQAR | 0.000 | 0.000 | 0.000 | 0.473 | 0.175 | 0.116 | 0.168 | 0.067 |
| Plot | Lyso | Other | |||||||||||
| Expt C |
7 peptides |
20 spectra |
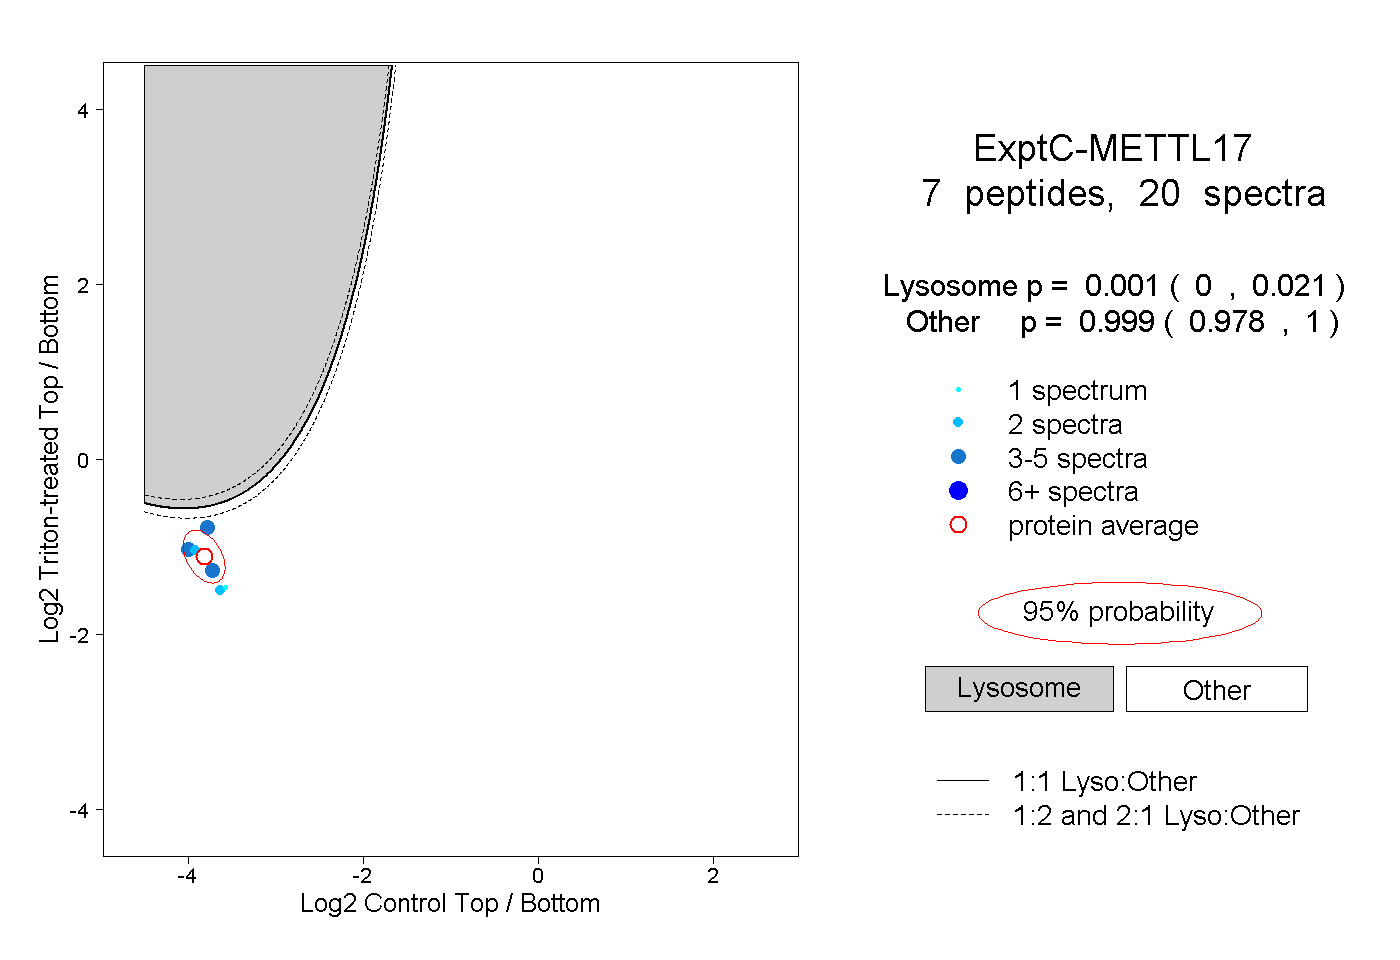 |
0.001 0.000 | 0.021 |
0.999 0.978 | 1.000 |