 2
2peptides
spectra
0.093 | 0.247
0.000 | 0.241
0.019 | 0.305
0.000 | 0.017
0.000 | 0.196
0.289 | 0.548
0.000 | 0.040
0.000 | 0.037
6peptides
spectra
0.000 | 0.000
1.000 | 1.000
| Plot | Mito | Lyso | Perox | ER | Golgi | PM | Cytosol | Nucleus | |||||
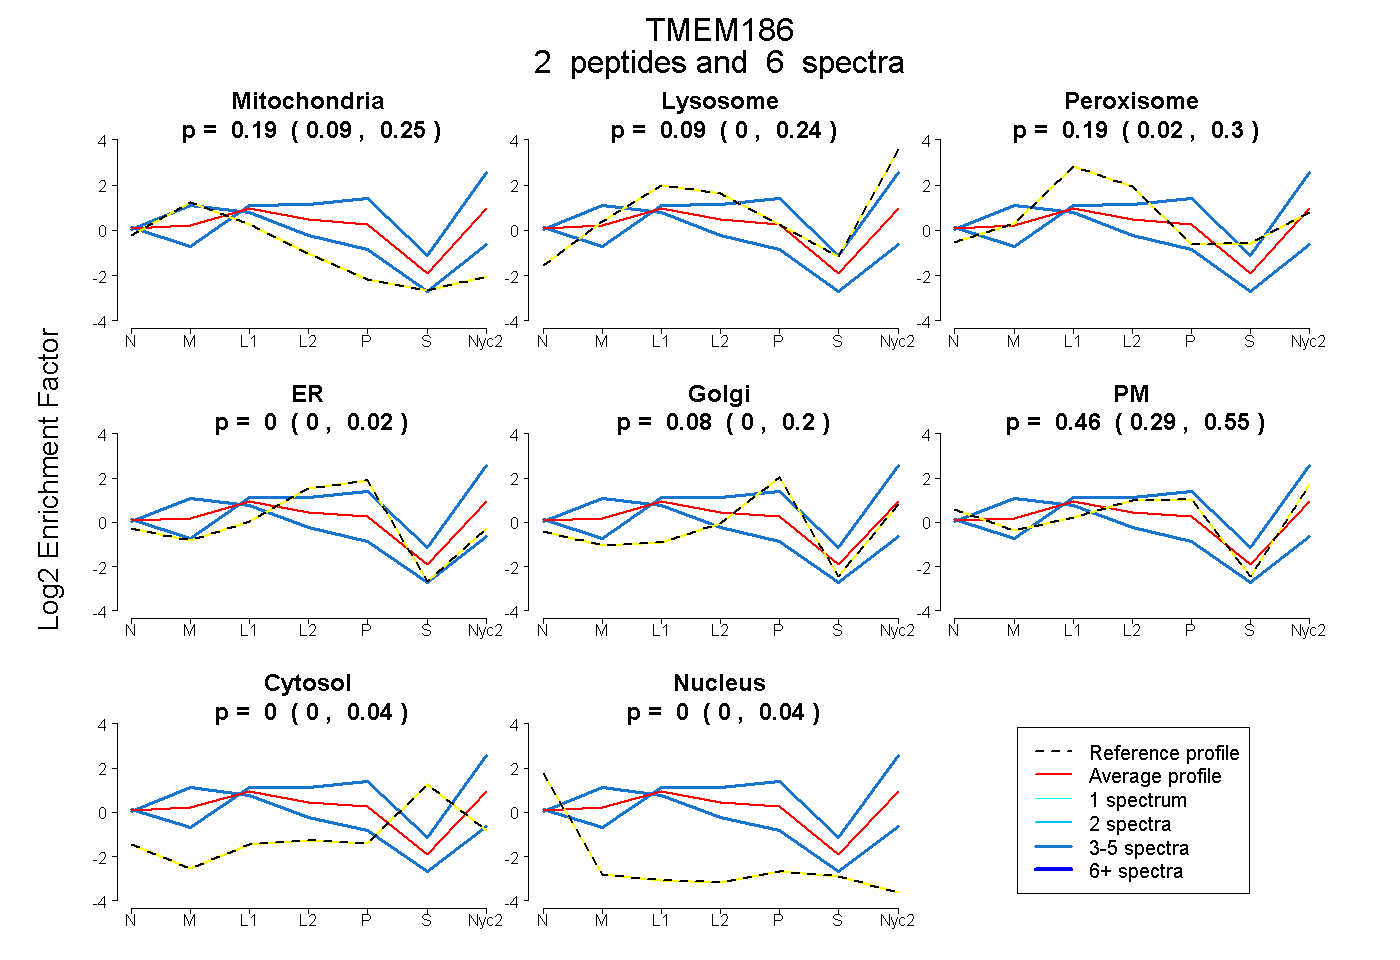
| Expt A |
2 peptides |
6 spectra |
|
0.191 0.093 | 0.247 |
0.090 0.000 | 0.241 |
0.186 0.019 | 0.305 |
0.000 0.000 | 0.017 |
0.076 0.000 | 0.196 |
0.457 0.289 | 0.548 |
0.000 0.000 | 0.040 |
0.000 0.000 | 0.037 |
||
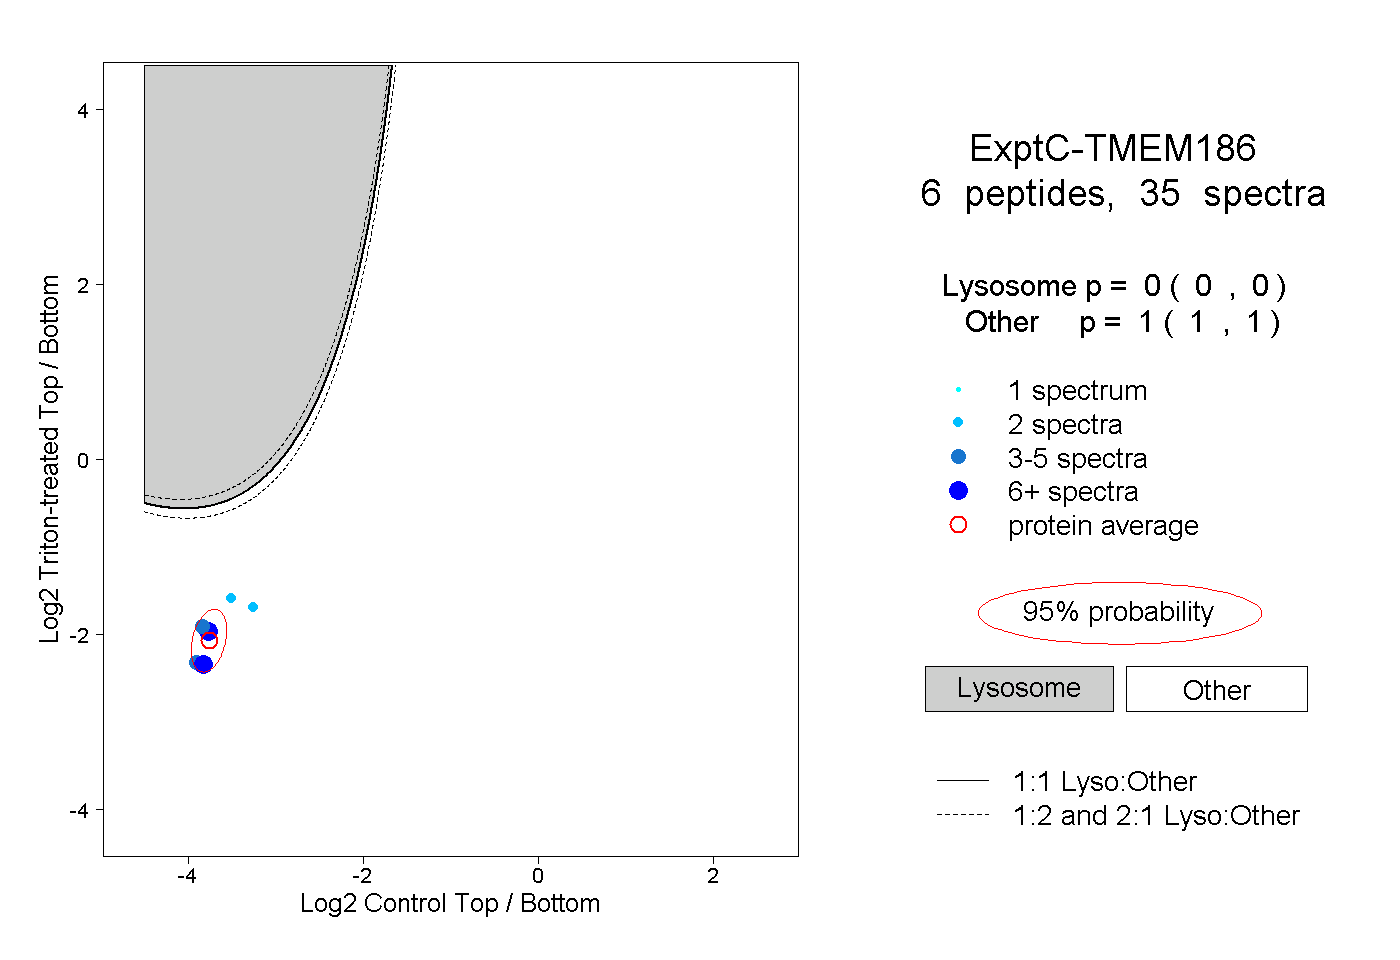
| Plot | Lyso | Other | |||||||||||
| Expt C |
6 peptides |
35 spectra |
|
0.000 0.000 | 0.000 |
1.000 1.000 | 1.000 |