PSMD11
[ENSRNOP00000062146]
Main page
| | | Plot |
Mito |
Lyso |
|
Perox |
ER |
Golgi |
PM |
Cytosol |
Nucleus |
|
| Expt A |
 21
21
peptides |
58
spectra |
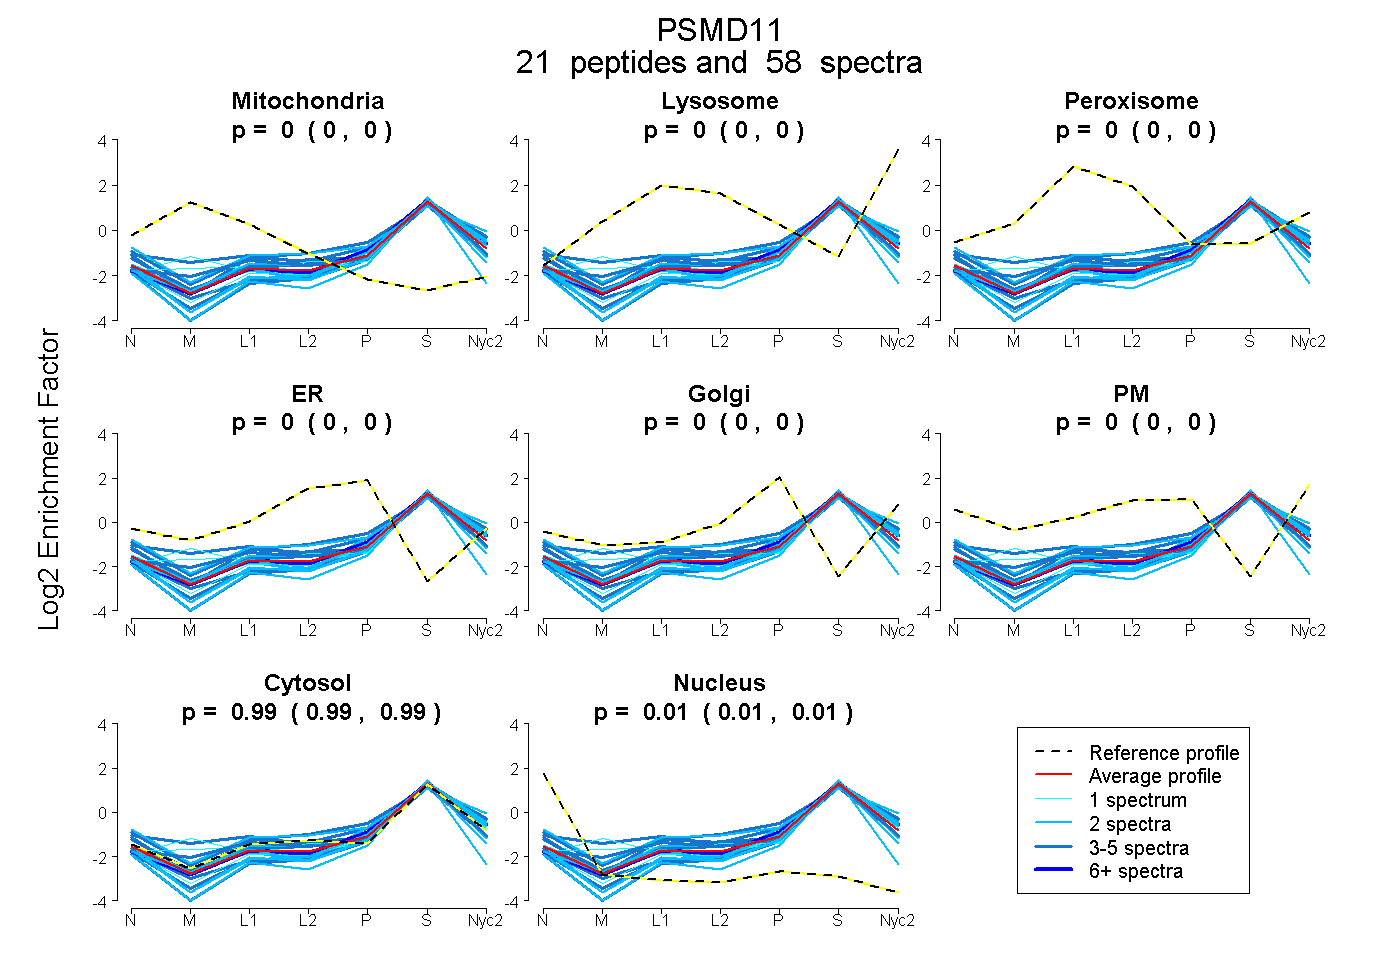 |
0.000
0.000 | 0.000 |
0.000
0.000 | 0.000 |
|
0.000
0.000 | 0.000 |
0.000
0.000 | 0.000 |
0.000
0.000 | 0.000 |
0.000
0.000 | 0.000 |
0.989
0.986 | 0.991 |
0.011
0.008 | 0.013 |
|
| | | Plot |
Mito |
|
Lyso or Perox |
|
ER |
Golgi |
PM |
Cytosol |
Nucleus |
|
| Expt B |
7
peptides |
15
spectra |
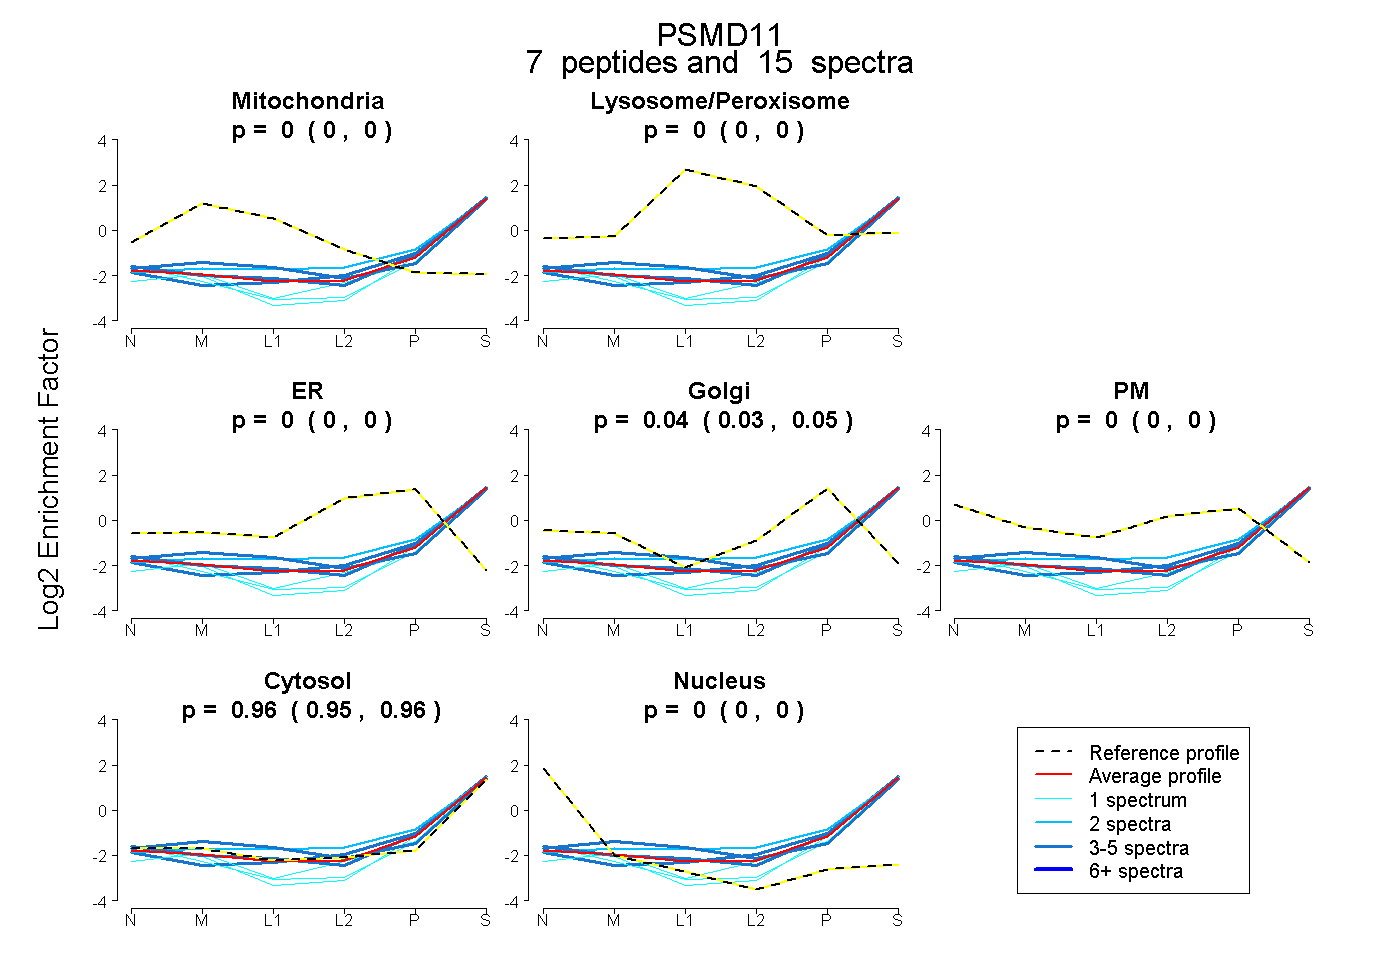 |
0.000
0.000 | 0.000 |
|
0.000
0.000 | 0.000 |
|
0.000
0.000 | 0.000 |
0.043
0.035 | 0.050 |
0.000
0.000 | 0.000 |
0.957
0.949 | 0.963 |
0.000
0.000 | 0.000 |
|
| | | Plot |
|
Lyso |
|
|
|
|
|
|
|
Other |
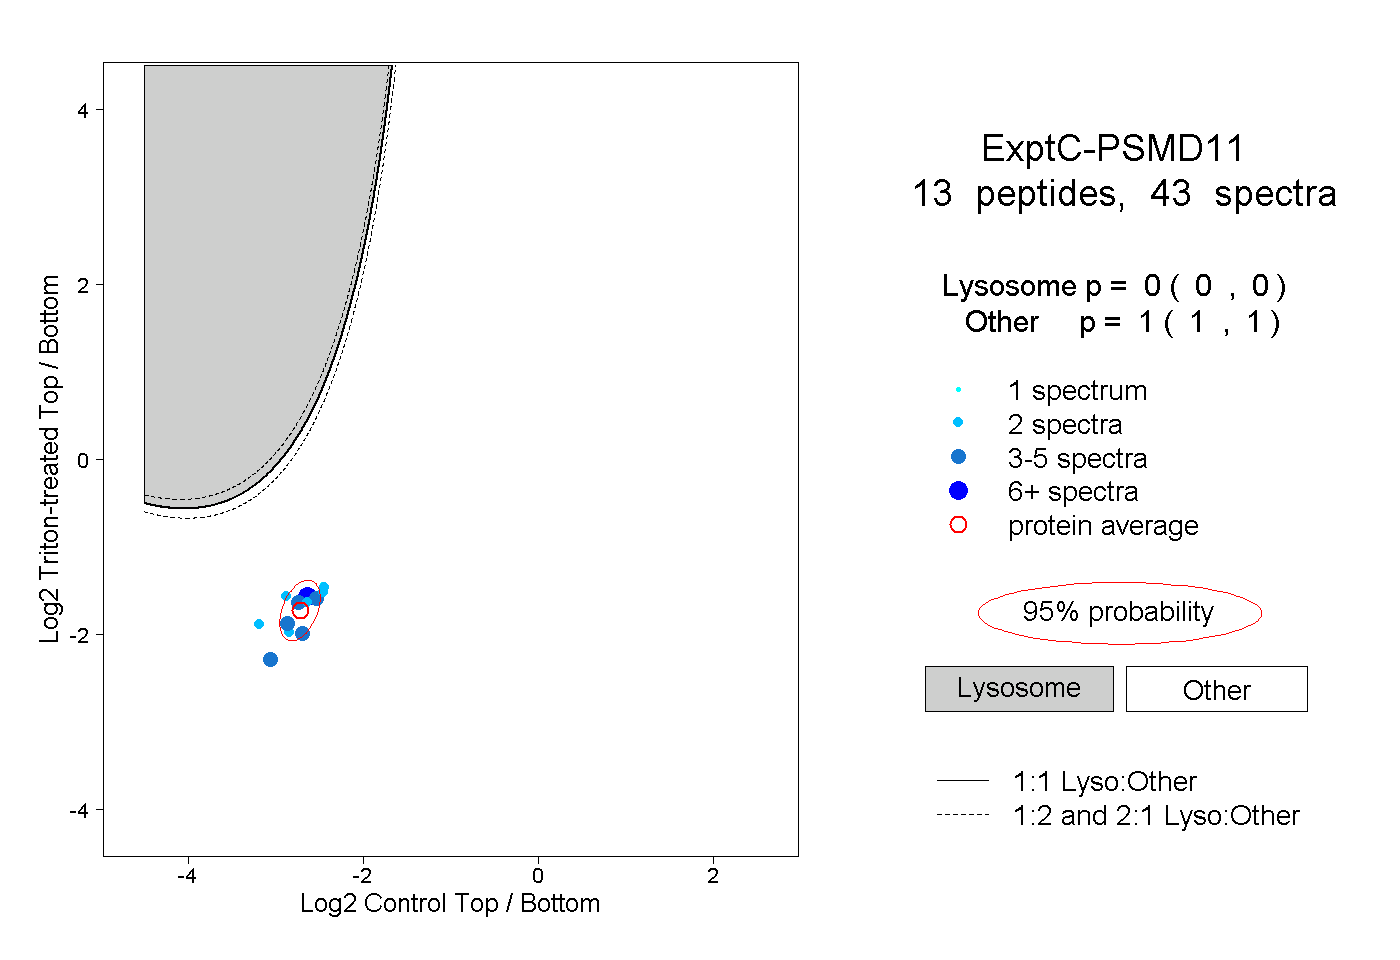
| Expt C |
13
peptides |
43
spectra |
 |
|
0.000
0.000 | 0.000 |
|
|
|
|
|
|
|
1.000
1.000 | 1.000 |
| 2 spectra, YVRPFLNSISK |
|
0.000 |
|
|
|
|
|
|
|
1.000 |
| 2 spectra, SLADFEK |
|
0.000 |
|
|
|
|
|
|
|
1.000 |
| 3 spectra, LYDNLLEQNLIR |
|
0.000 |
|
|
|
|
|
|
|
1.000 |
| 1 spectrum, TGQAAELGGLLK |
|
0.000 |
|
|
|
|
|
|
|
1.000 |
| 2 spectra, VIEPFSR |
|
0.000 |
|
|
|
|
|
|
|
1.000 |
| 3 spectra, EASIDILHSIVK |
|
0.000 |
|
|
|
|
|
|
|
1.000 |
| 2 spectra, TYHALSNLPK |
|
0.000 |
|
|
|
|
|
|
|
1.000 |
| 4 spectra, CVAQASK |
|
0.000 |
|
|
|
|
|
|
|
1.000 |
| 5 spectra, YMLLCK |
|
0.000 |
|
|
|
|
|
|
|
1.000 |
| 12 spectra, AQSLLSTDR |
|
0.000 |
|
|
|
|
|
|
|
1.000 |
| 3 spectra, TTANAIYCPPK |
|
0.000 |
|
|
|
|
|
|
|
1.000 |
| 2 spectra, QALEAR |
|
0.000 |
|
|
|
|
|
|
|
1.000 |
| 2 spectra, QTEALK |
|
0.000 |
|
|
|
|
|
|
|
1.000 |
| | | Plot |
|
Lyso |
|
|
|
|
|
|
|
Other |
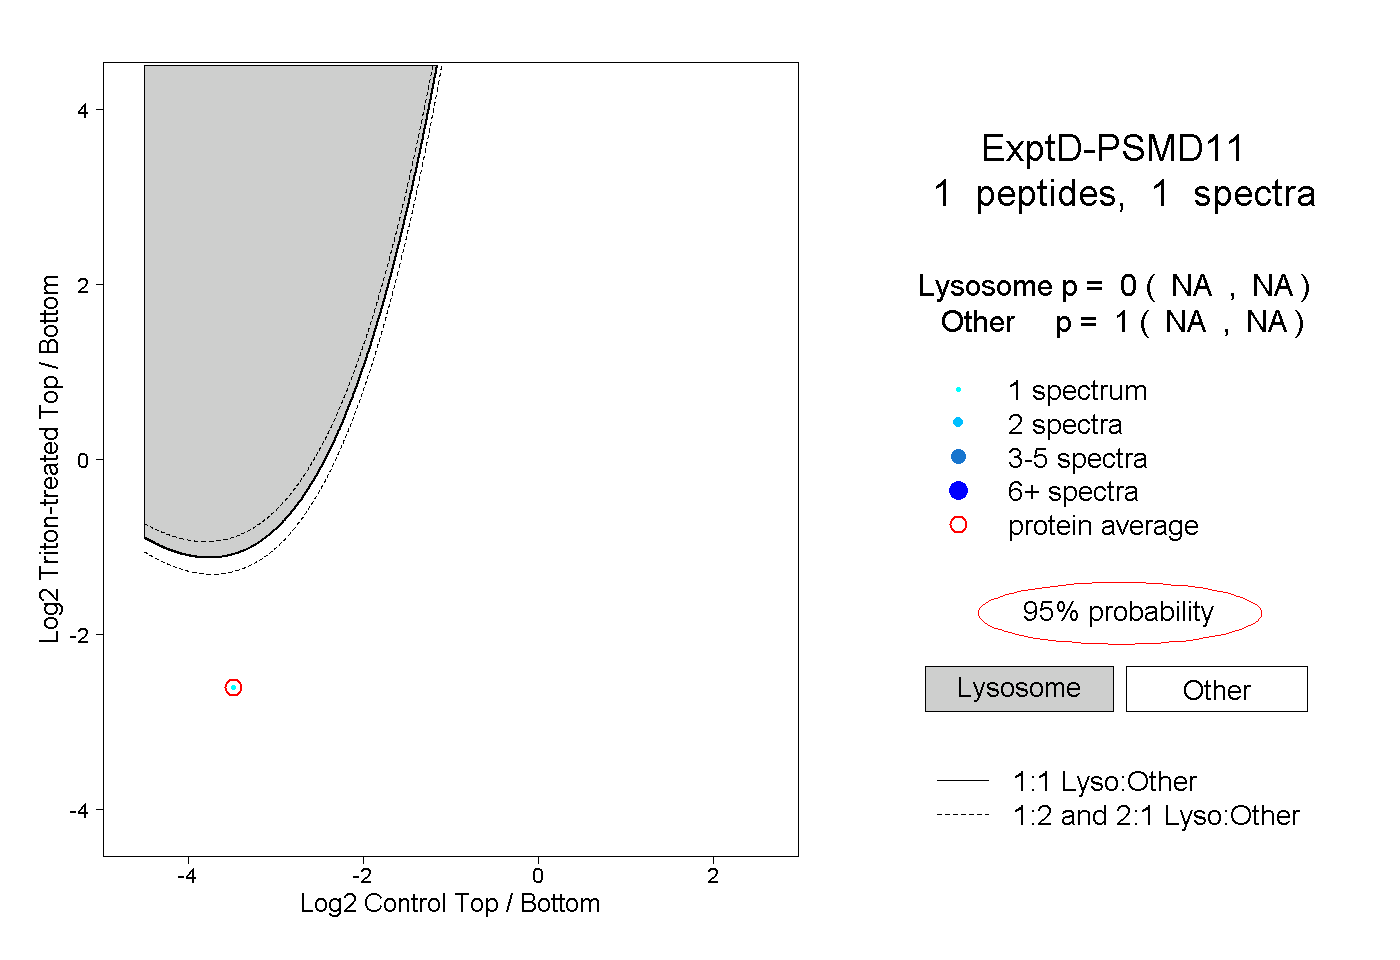
| Expt D |
1
peptide |
1
spectrum |
 |
|
0.000
NA | NA |
|
|
|
|
|
|
|
1.000
NA | NA |