 3
3peptides
spectra
0.000 | 0.000
0.344 | 0.445
0.000 | 0.000
0.000 | 0.000
0.000 | 0.000
0.302 | 0.399
0.221 | 0.268
0.000 | 0.000
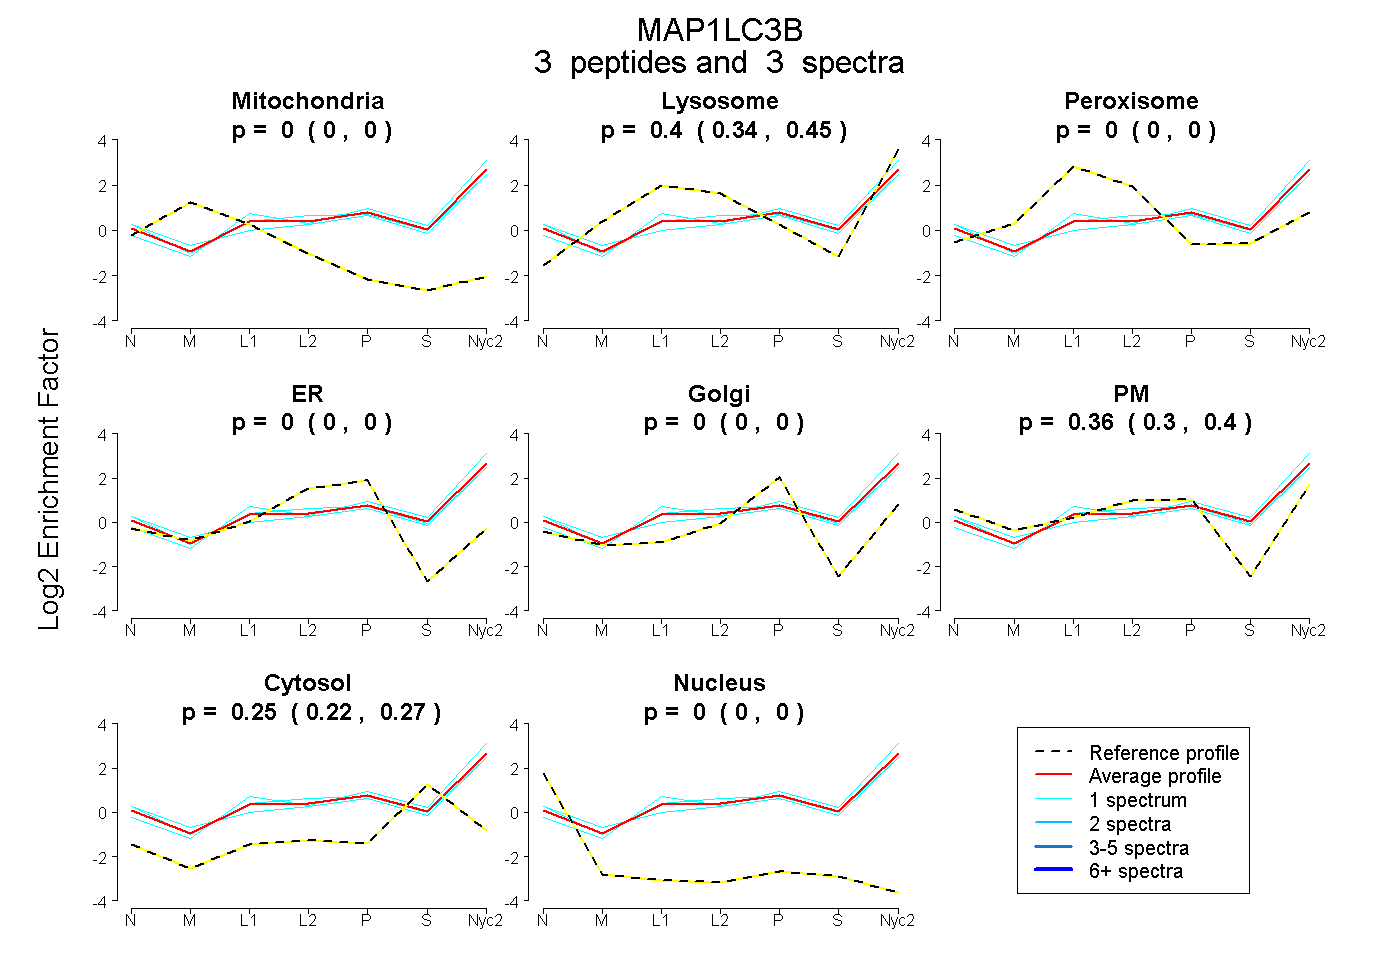
| Plot | Mito | Lyso | Perox | ER | Golgi | PM | Cytosol | Nucleus | |||||
| Expt A |
3 peptides |
3 spectra |
|
0.000 0.000 | 0.000 |
0.397 0.344 | 0.445 |
0.000 0.000 | 0.000 |
0.000 0.000 | 0.000 |
0.000 0.000 | 0.000 |
0.356 0.302 | 0.399 |
0.247 0.221 | 0.268 |
0.000 0.000 | 0.000 |
| 1 spectrum, EQHPTK | 0.000 | 0.353 | 0.000 | 0.000 | 0.000 | 0.406 | 0.241 | 0.000 | ||
| 1 spectrum, QLPVLDK | 0.000 | 0.301 | 0.000 | 0.000 | 0.000 | 0.445 | 0.254 | 0.000 | ||
| 1 spectrum, FLVPDHVNMSELIK | 0.000 | 0.547 | 0.000 | 0.000 | 0.046 | 0.169 | 0.238 | 0.000 |
| Plot | Mito | Lyso or Perox | ER | Golgi | PM | Cytosol | Nucleus | ||||||
| Expt B |
1 peptide |
1 spectrum |
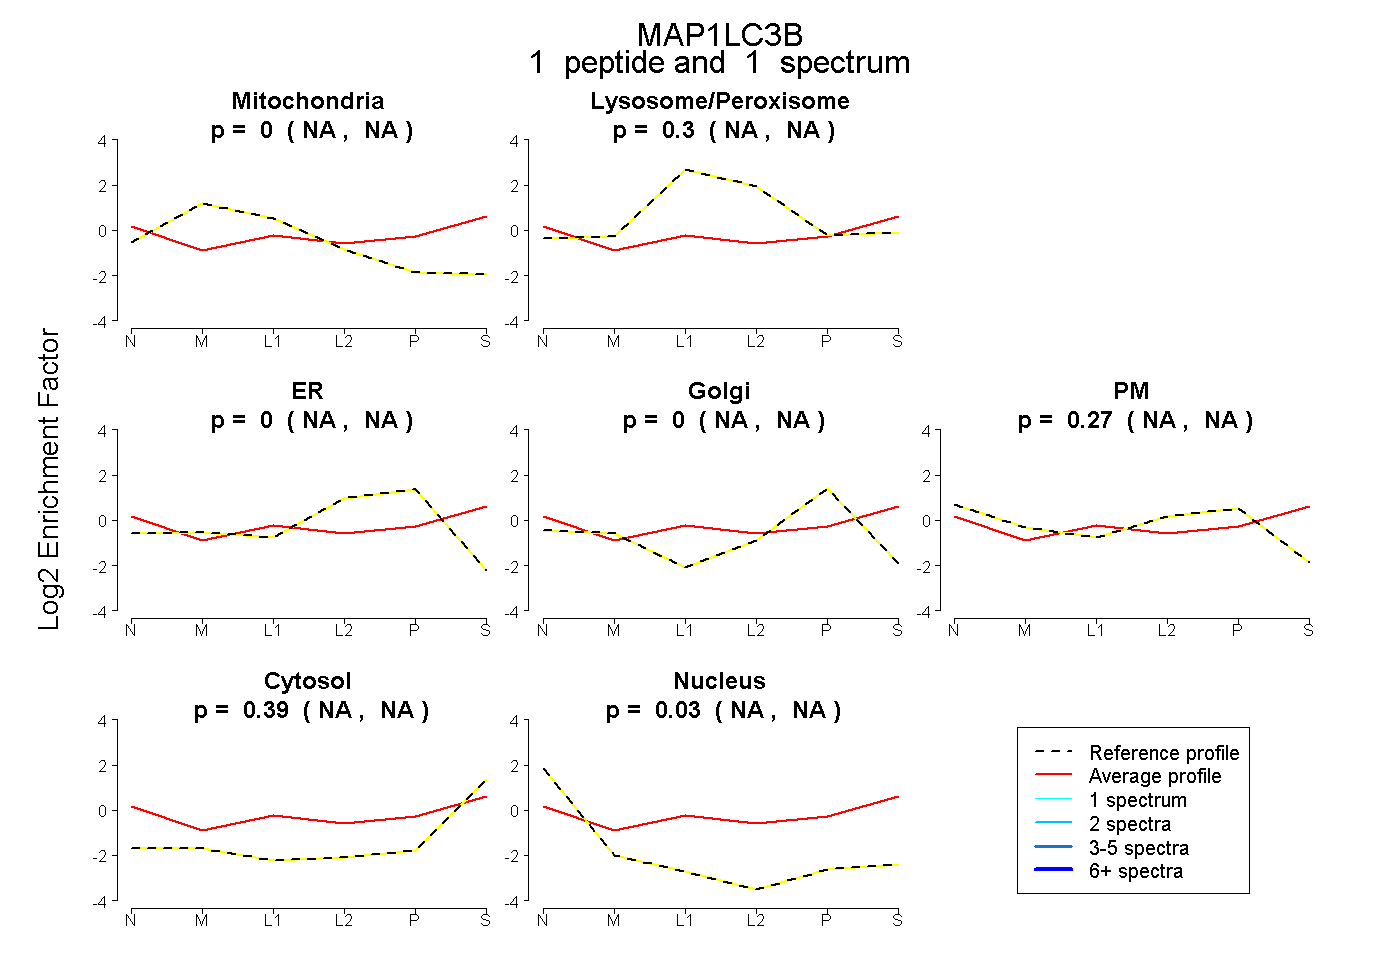 |
0.000 NA | NA |
0.305 NA | NA |
0.000 NA | NA |
0.000 NA | NA |
0.271 NA | NA |
0.393 NA | NA |
0.031 NA | NA |
|||
| Plot | Lyso | Other | |||||||||||
| Expt C |
3 peptides |
12 spectra |
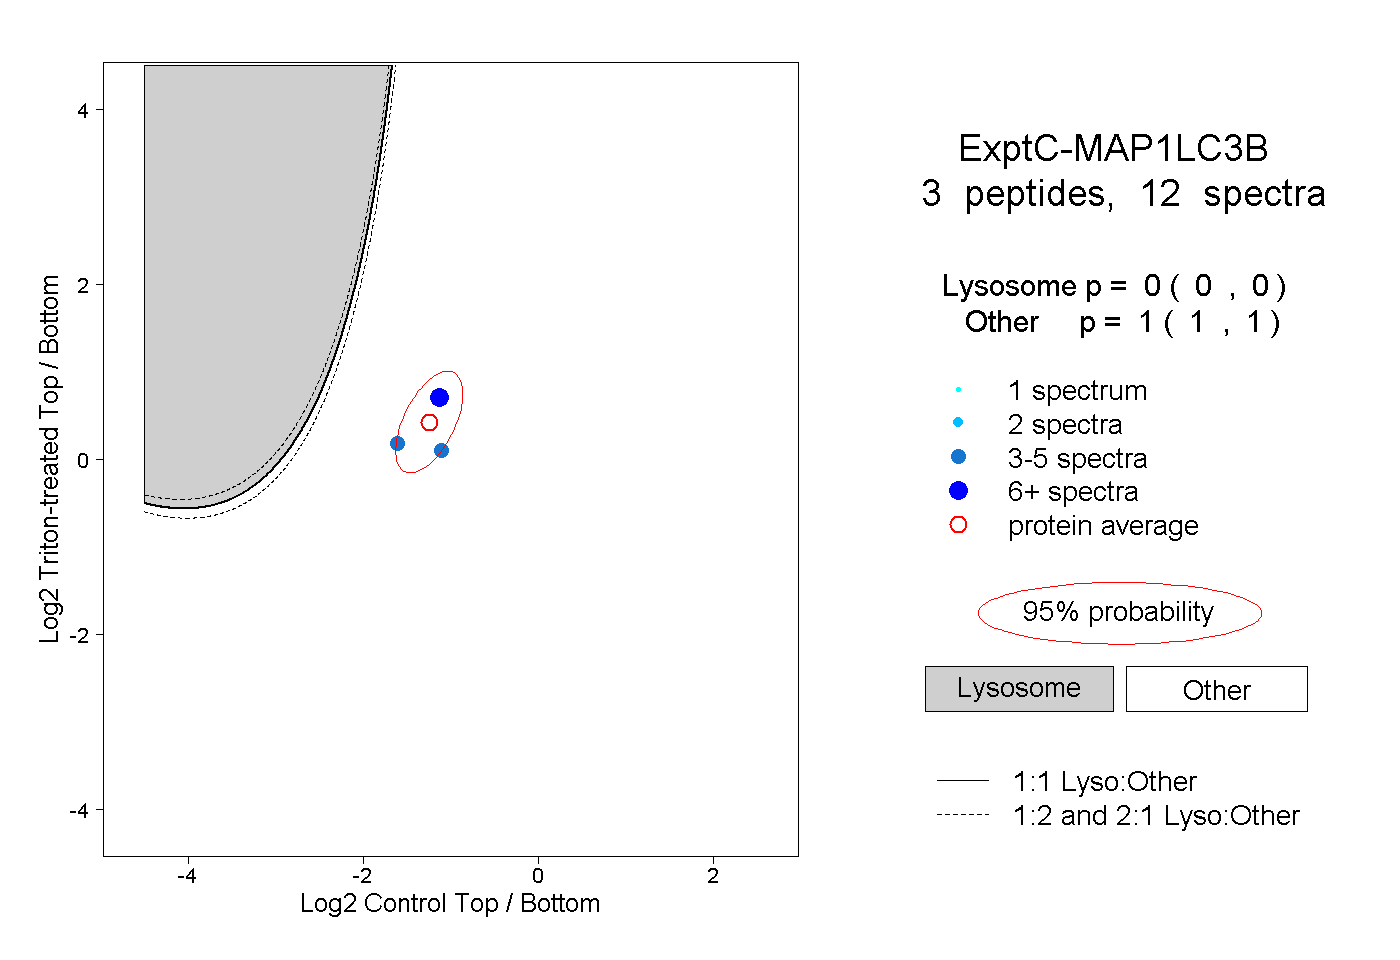 |
0.000 0.000 | 0.000 |
1.000 1.000 | 1.000 |
||||||||
| Plot | Lyso | Other | |||||||||||
| Expt D |
1 peptide |
1 spectrum |
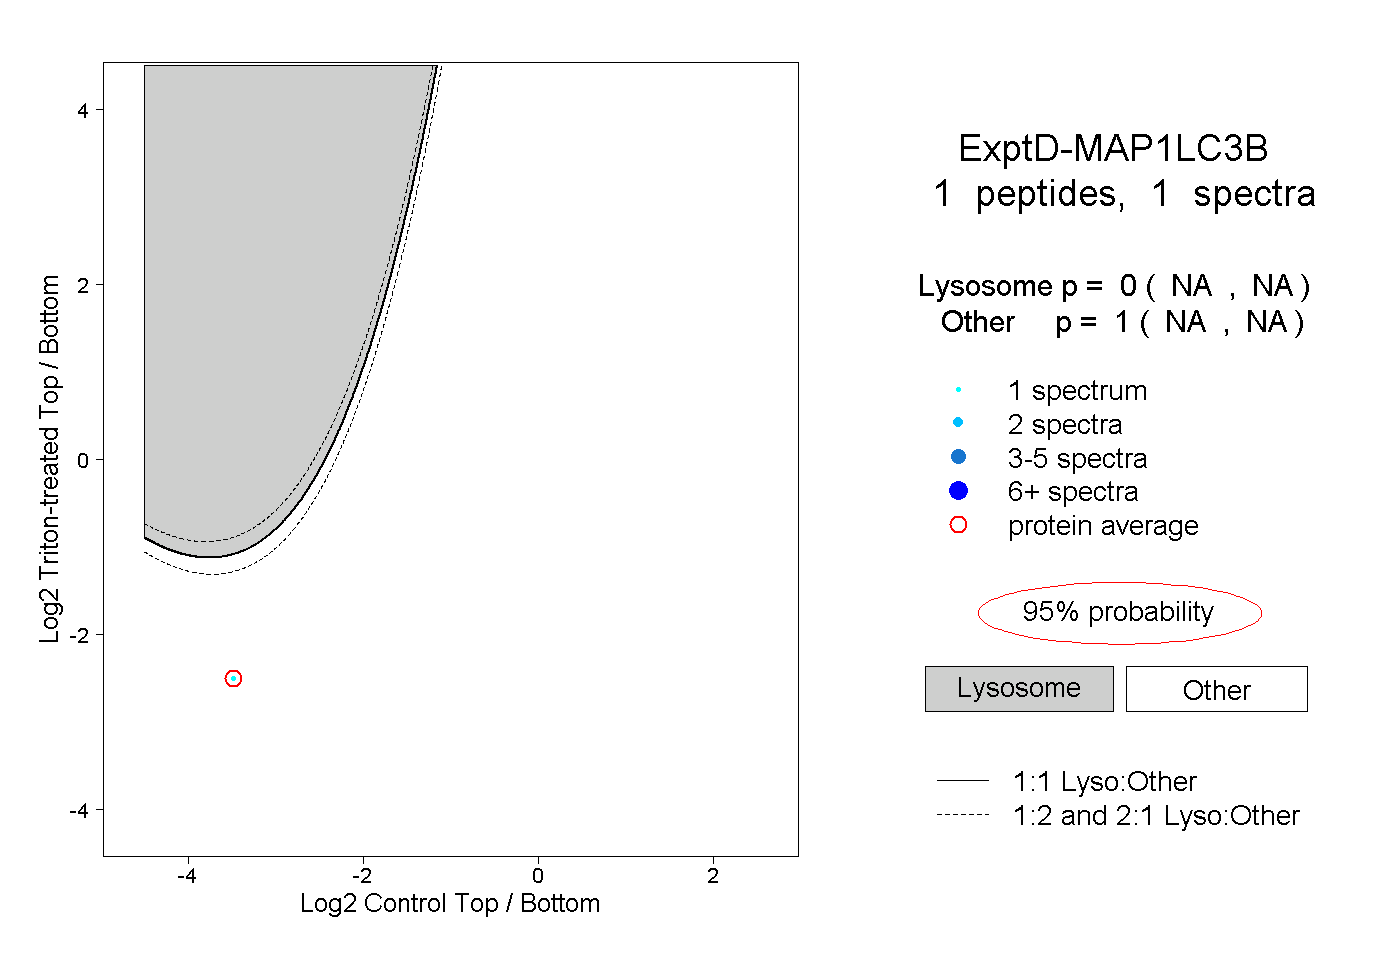 |
0.000 NA | NA |
1.000 NA | NA |