 7
7peptides
spectra
0.000 | 0.000
0.000 | 0.000
0.000 | 0.000
0.198 | 0.358
0.000 | 0.138
0.000 | 0.000
0.191 | 0.223
0.414 | 0.467
| Plot | Mito | Lyso | Perox | ER | Golgi | PM | Cytosol | Nucleus | |||||
| Expt A |
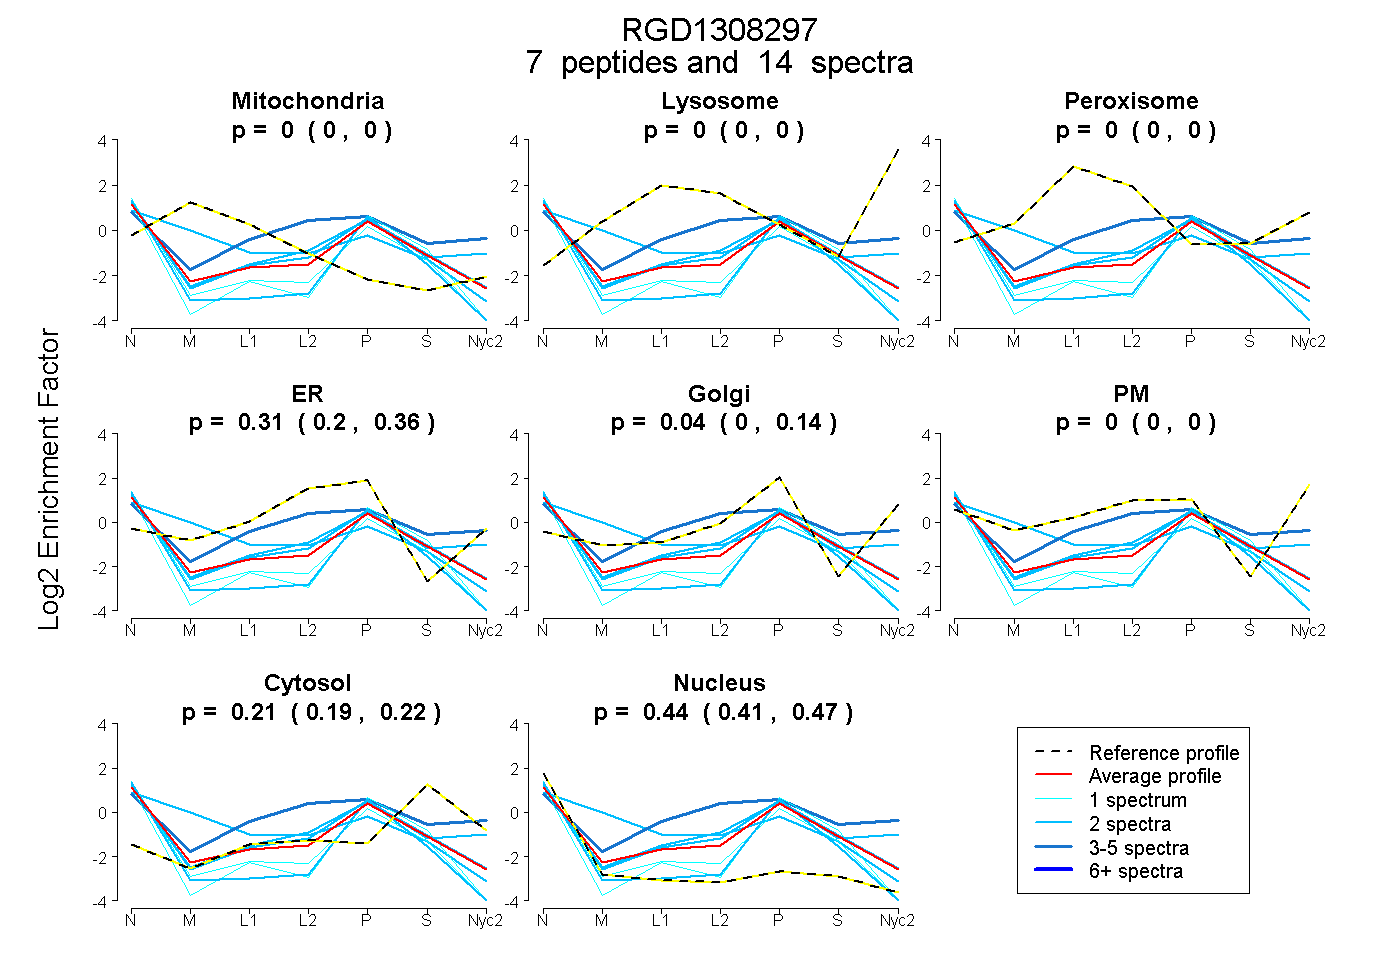
7 peptides |
14 spectra |
|
0.000 0.000 | 0.000 |
0.000 0.000 | 0.000 |
0.000 0.000 | 0.000 |
0.311 0.198 | 0.358 |
0.035 0.000 | 0.138 |
0.000 0.000 | 0.000 |
0.209 0.191 | 0.223 |
0.444 0.414 | 0.467 |
| 1 spectrum, MIIENFEALK | 0.000 | 0.000 | 0.000 | 0.019 | 0.106 | 0.000 | 0.241 | 0.634 | ||
| 4 spectra, GVPGHAVVDHRPR | 0.000 | 0.000 | 0.031 | 0.308 | 0.000 | 0.259 | 0.327 | 0.074 | ||
| 1 spectrum, IVVDSESR | 0.000 | 0.000 | 0.000 | 0.194 | 0.000 | 0.000 | 0.138 | 0.668 | ||
| 2 spectra, TWFDKPNFNR | 0.000 | 0.000 | 0.000 | 0.000 | 0.207 | 0.000 | 0.074 | 0.720 | ||
| 2 spectra, AEAEAAAVHGAR | 0.364 | 0.000 | 0.000 | 0.265 | 0.000 | 0.000 | 0.087 | 0.284 | ||
| 2 spectra, TLEPICDADPSALAK | 0.000 | 0.000 | 0.000 | 0.388 | 0.000 | 0.000 | 0.210 | 0.402 | ||
| 2 spectra, MQAGEEVTELR | 0.000 | 0.000 | 0.000 | 0.006 | 0.439 | 0.038 | 0.191 | 0.326 |
| Plot | Mito | Lyso or Perox | ER | Golgi | PM | Cytosol | Nucleus | ||||||
| Expt B |
1 peptide |
1 spectrum |
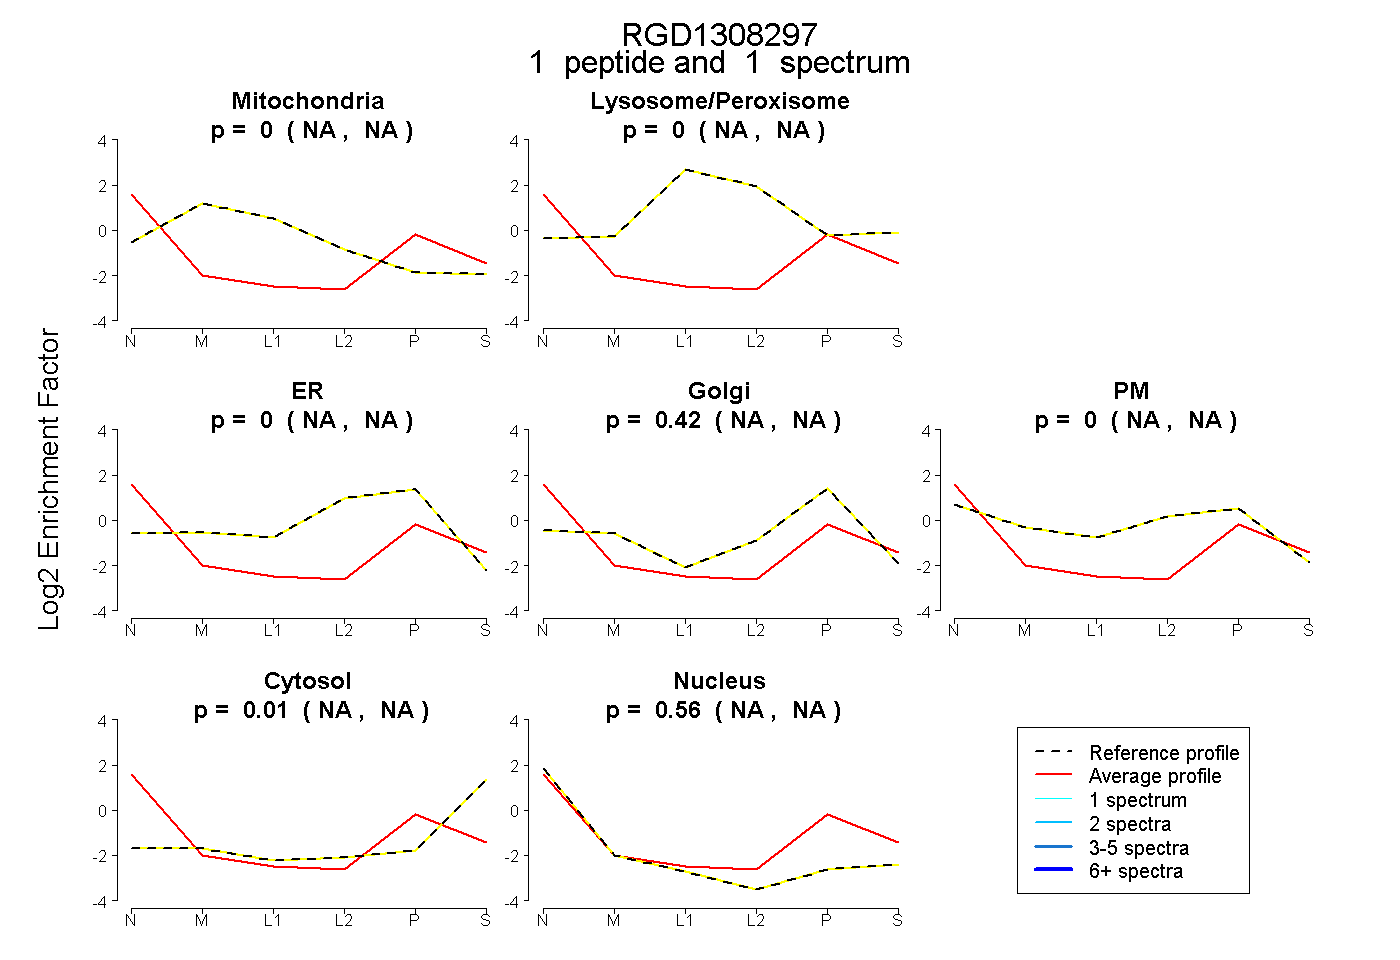 |
0.000 NA | NA |
0.000 NA | NA |
0.000 NA | NA |
0.424 NA | NA |
0.000 NA | NA |
0.012 NA | NA |
0.564 NA | NA |