 5
5peptides
spectra
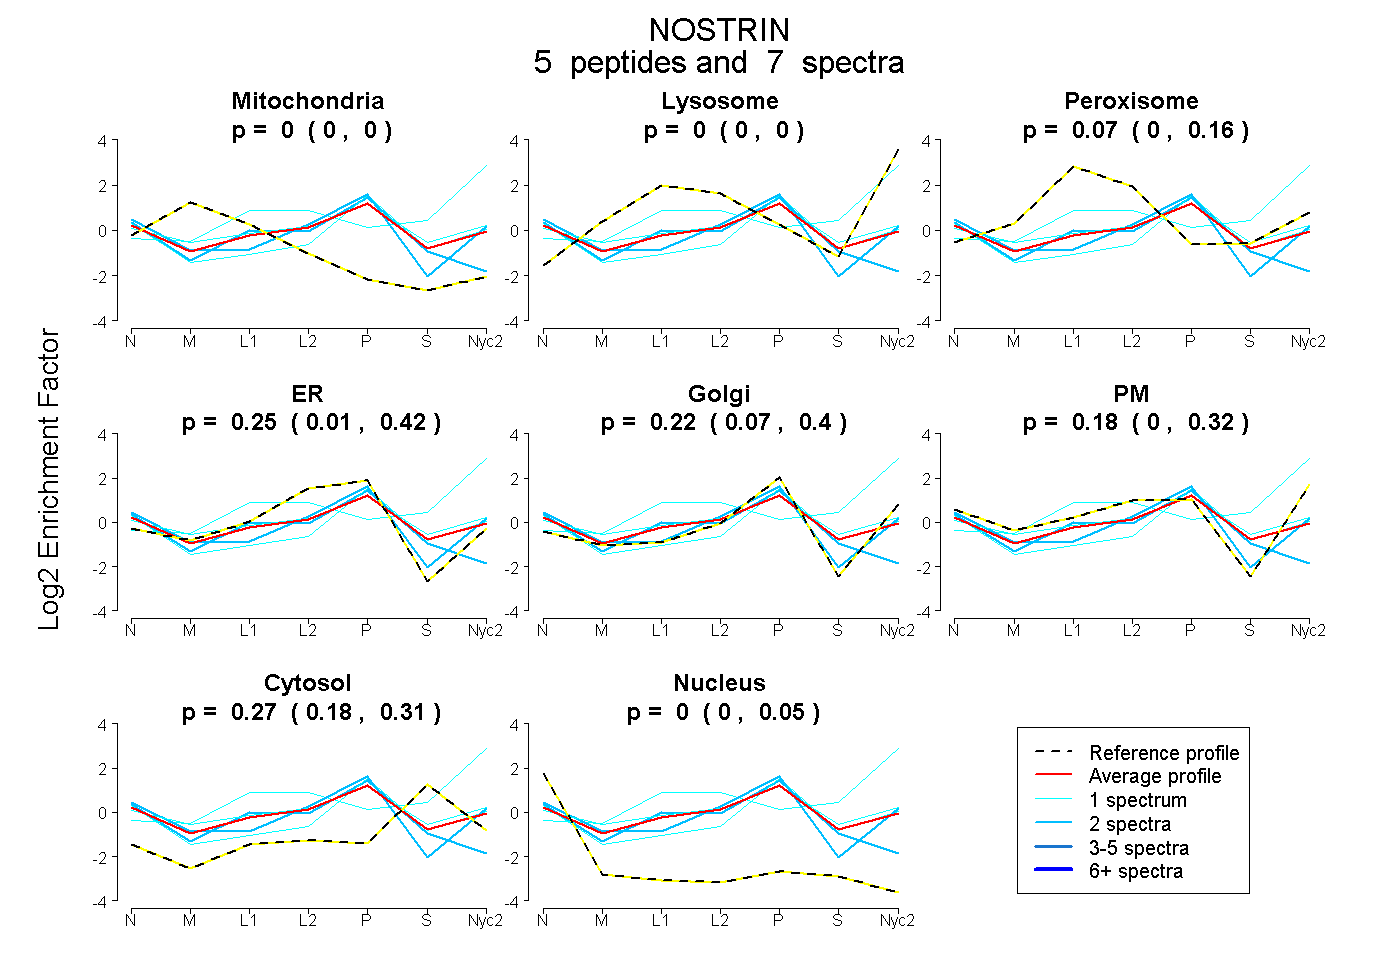
0.000 | 0.000
0.000 | 0.000
0.000 | 0.164
0.006 | 0.416
0.068 | 0.397
0.000 | 0.325
0.178 | 0.308
0.000 | 0.055
| Plot | Mito | Lyso | Perox | ER | Golgi | PM | Cytosol | Nucleus | |||||
| Expt A |
5 peptides |
7 spectra |
|
0.000 0.000 | 0.000 |
0.000 0.000 | 0.000 |
0.070 0.000 | 0.164 |
0.254 0.006 | 0.416 |
0.222 0.068 | 0.397 |
0.182 0.000 | 0.325 |
0.269 0.178 | 0.308 |
0.005 0.000 | 0.055 |
| 1 spectrum, NCLSTAWAWASESMK | 0.000 | 0.671 | 0.000 | 0.000 | 0.000 | 0.068 | 0.260 | 0.000 | ||
| 1 spectrum, GDIVTIHEK | 0.000 | 0.000 | 0.000 | 0.000 | 0.674 | 0.028 | 0.260 | 0.038 | ||
| 2 spectra, DAETLMDENSLK | 0.000 | 0.000 | 0.010 | 0.637 | 0.000 | 0.000 | 0.227 | 0.125 | ||
| 2 spectra, QITSVLQQR | 0.000 | 0.000 | 0.000 | 0.231 | 0.456 | 0.198 | 0.024 | 0.090 | ||
| 1 spectrum, SLDNEVEK | 0.000 | 0.000 | 0.205 | 0.058 | 0.425 | 0.094 | 0.218 | 0.000 |
| Plot | Lyso | Other | |||||||||||
| Expt C |
3 peptides |
4 spectra |
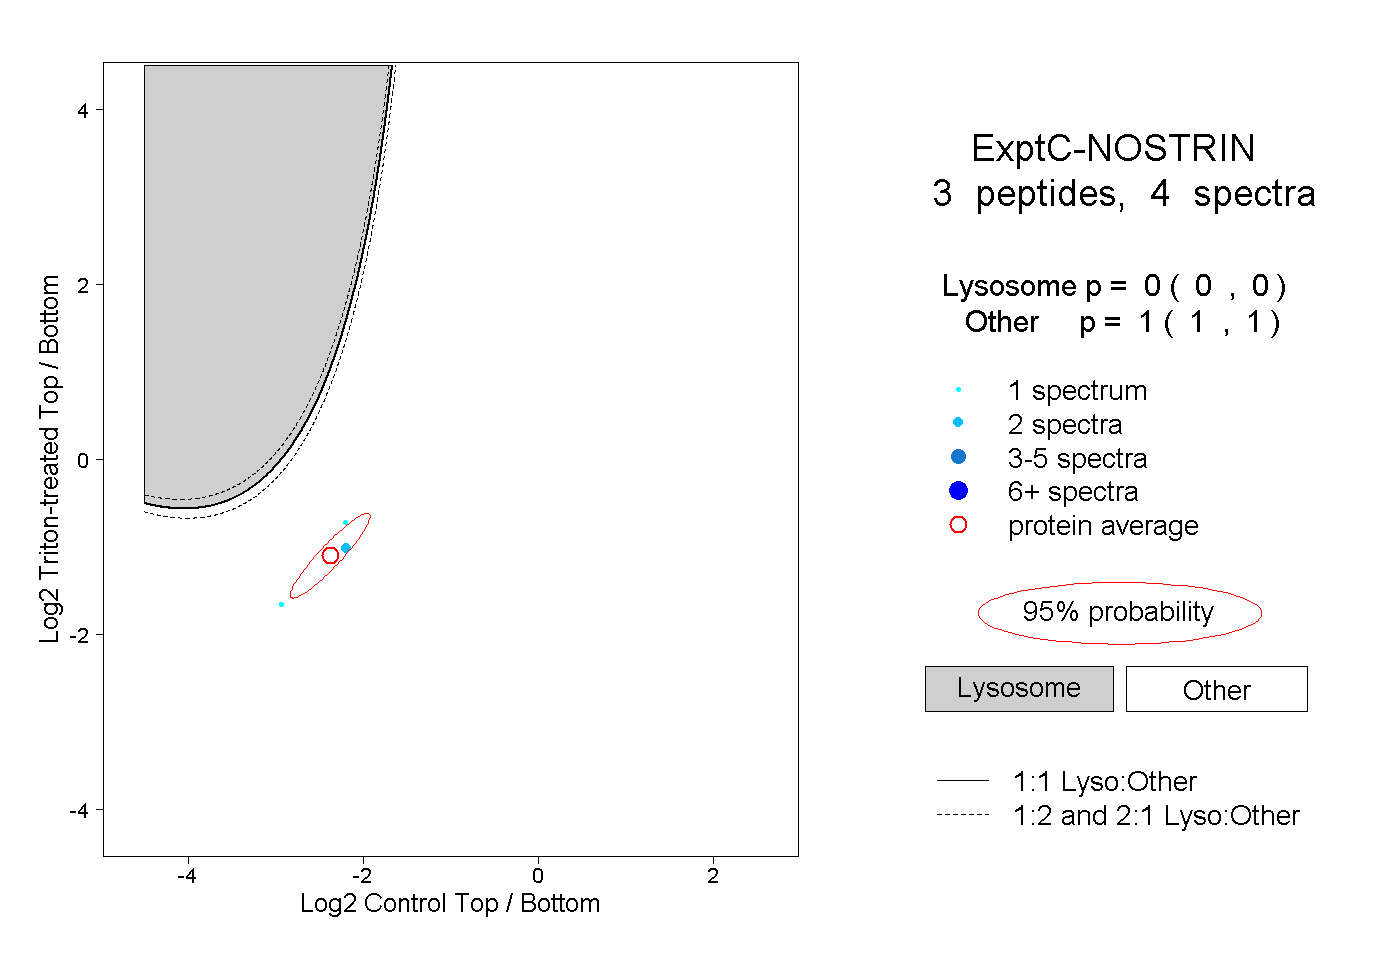 |
0.000 0.000 | 0.000 |
1.000 1.000 | 1.000 |