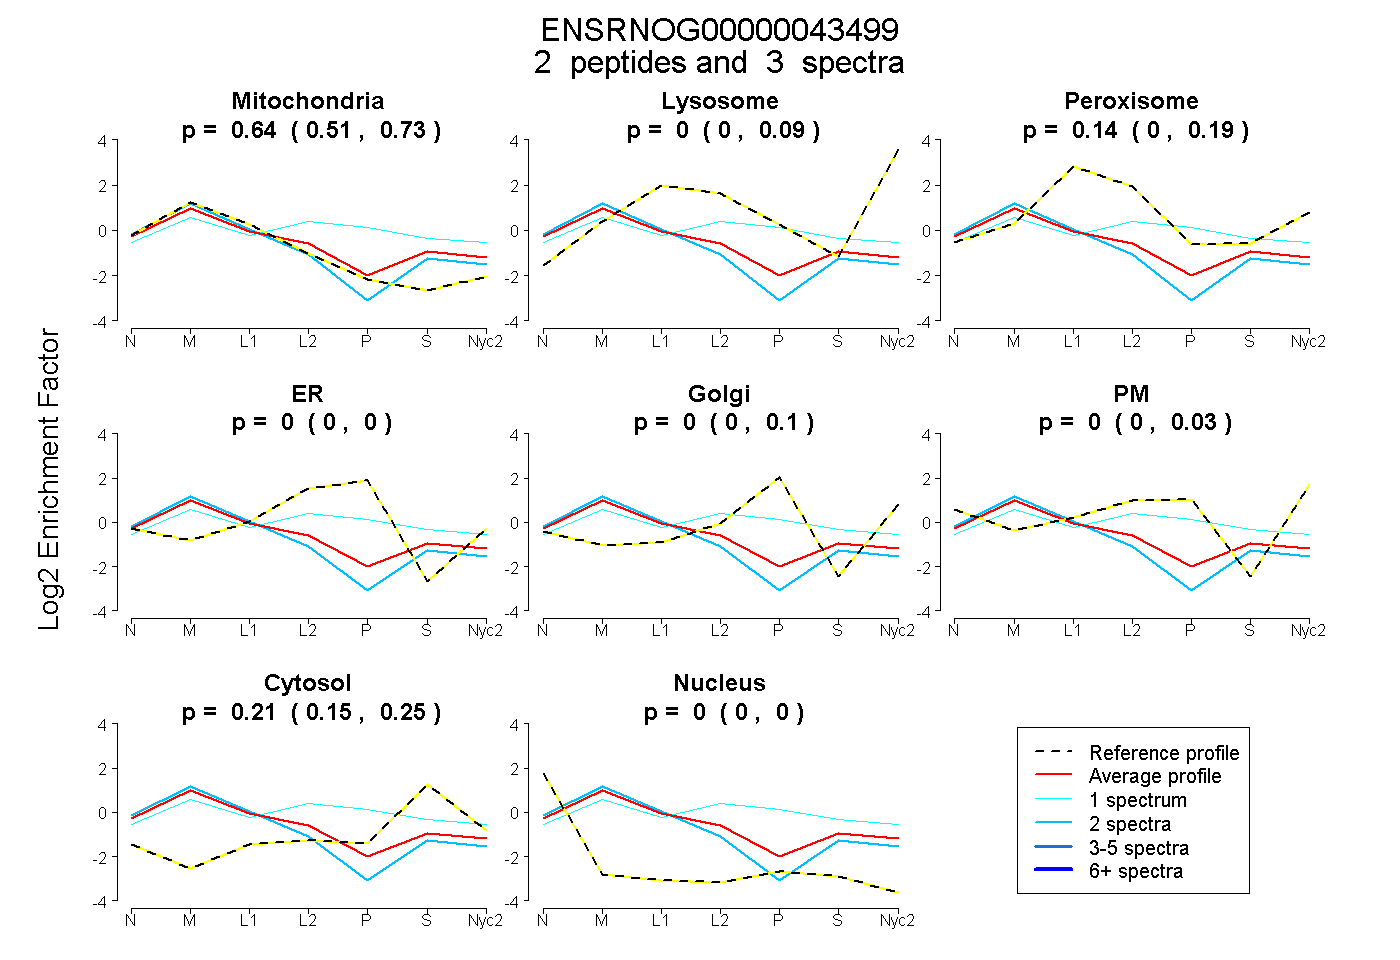
 2
2peptides
spectra
0.512 | 0.733
0.000 | 0.086
0.000 | 0.191
0.000 | 0.002
0.000 | 0.097
0.000 | 0.026
0.150 | 0.250
0.000 | 0.000
| Plot | Mito | Lyso | Perox | ER | Golgi | PM | Cytosol | Nucleus | |||||
| Expt A |
2 peptides |
3 spectra |
|
0.644 0.512 | 0.733 |
0.001 0.000 | 0.086 |
0.144 0.000 | 0.191 |
0.000 0.000 | 0.002 |
0.000 0.000 | 0.097 |
0.000 0.000 | 0.026 |
0.211 0.150 | 0.250 |
0.000 0.000 | 0.000 |
| 2 spectra, SIVPALEIANAHR | 0.827 | 0.000 | 0.013 | 0.000 | 0.000 | 0.000 | 0.161 | 0.000 | ||
| 1 spectrum, GVMLTVDAVIAELK | 0.212 | 0.000 | 0.258 | 0.155 | 0.140 | 0.000 | 0.234 | 0.000 |
| Plot | Lyso | Other | |||||||||||
| Expt C |
1 peptide |
1 spectrum |
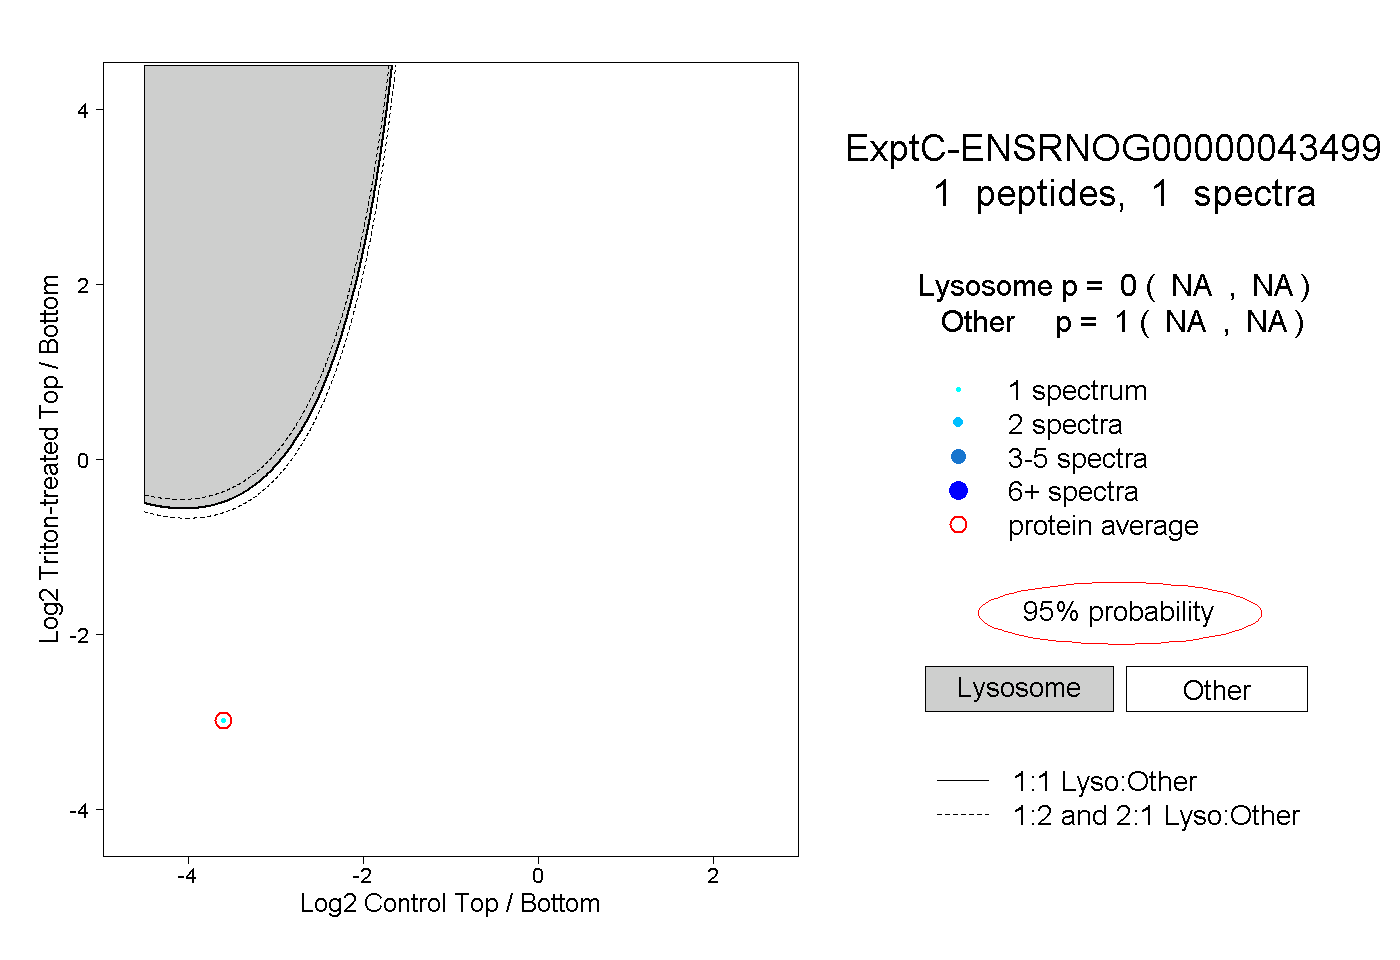 |
0.000 NA | NA |
1.000 NA | NA |