 13
13peptides
spectra
0.000 | 0.013
0.963 | 0.986
0.000 | 0.021
0.000 | 0.000
0.000 | 0.000
0.000 | 0.000
0.002 | 0.019
0.000 | 0.000
| Plot | Mito | Lyso | Perox | ER | Golgi | PM | Cytosol | Nucleus | |||||
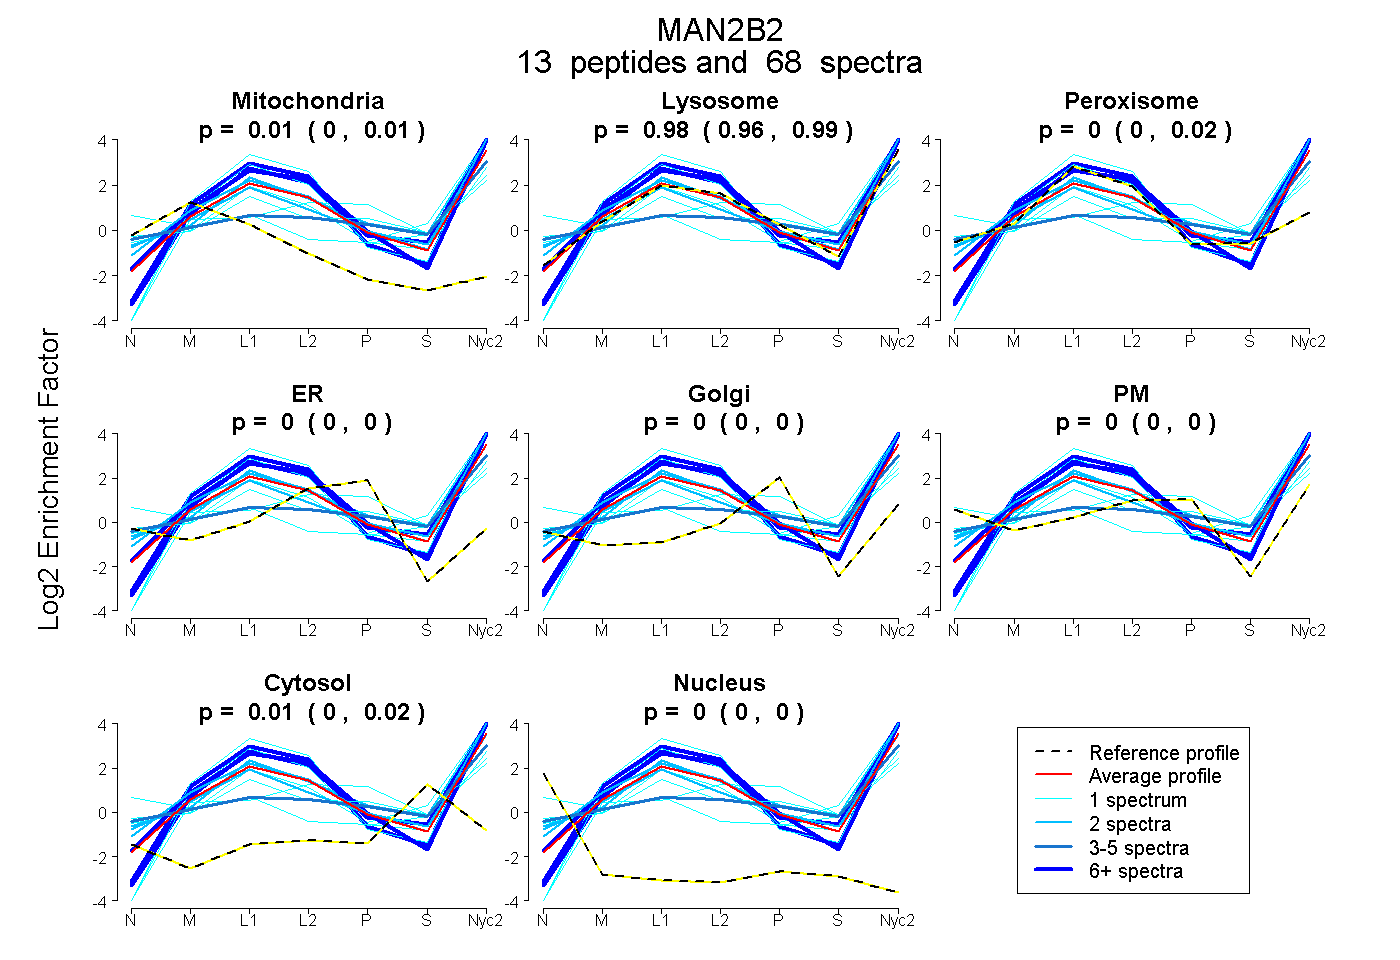
| Expt A |
13 peptides |
68 spectra |
|
0.006 0.000 | 0.013 |
0.980 0.963 | 0.986 |
0.002 0.000 | 0.021 |
0.000 0.000 | 0.000 |
0.000 0.000 | 0.000 |
0.000 0.000 | 0.000 |
0.012 0.002 | 0.019 |
0.000 0.000 | 0.000 |
| 1 spectrum, LWWDGVASEQQK | 0.000 | 1.000 | 0.000 | 0.000 | 0.000 | 0.000 | 0.000 | 0.000 | ||
| 36 spectra, STTTALRPR | 0.000 | 1.000 | 0.000 | 0.000 | 0.000 | 0.000 | 0.000 | 0.000 | ||
| 2 spectra, GLGSVVAVEER | 0.000 | 0.957 | 0.043 | 0.000 | 0.000 | 0.000 | 0.000 | 0.000 | ||
| 4 spectra, YMWPHPR | 0.000 | 0.626 | 0.000 | 0.000 | 0.000 | 0.190 | 0.184 | 0.000 | ||
| 10 spectra, QLLDEGR | 0.000 | 1.000 | 0.000 | 0.000 | 0.000 | 0.000 | 0.000 | 0.000 | ||
| 1 spectrum, AFVVPHSHMDVGWVYTVQESMR | 0.000 | 0.900 | 0.000 | 0.000 | 0.000 | 0.000 | 0.100 | 0.000 | ||
| 2 spectra, SGVALQHRPVVLLK | 0.000 | 0.920 | 0.022 | 0.000 | 0.000 | 0.000 | 0.030 | 0.028 | ||
| 1 spectrum, LAHVHPSLAGELLCR | 0.000 | 0.770 | 0.000 | 0.000 | 0.017 | 0.000 | 0.212 | 0.000 | ||
| 1 spectrum, QASALLYAGESMFTR | 0.000 | 0.686 | 0.000 | 0.000 | 0.000 | 0.101 | 0.000 | 0.213 | ||
| 1 spectrum, TVHMTQEFLEYR | 0.000 | 0.524 | 0.128 | 0.000 | 0.000 | 0.184 | 0.164 | 0.000 | ||
| 1 spectrum, SNPIPR | 0.000 | 1.000 | 0.000 | 0.000 | 0.000 | 0.000 | 0.000 | 0.000 | ||
| 6 spectra, FIAVEQEFFR | 0.000 | 1.000 | 0.000 | 0.000 | 0.000 | 0.000 | 0.000 | 0.000 | ||
| 2 spectra, TPHVLWPWGCDK | 0.000 | 1.000 | 0.000 | 0.000 | 0.000 | 0.000 | 0.000 | 0.000 |
| Plot | Mito | Lyso or Perox | ER | Golgi | PM | Cytosol | Nucleus | ||||||
| Expt B |
6 peptides |
9 spectra |
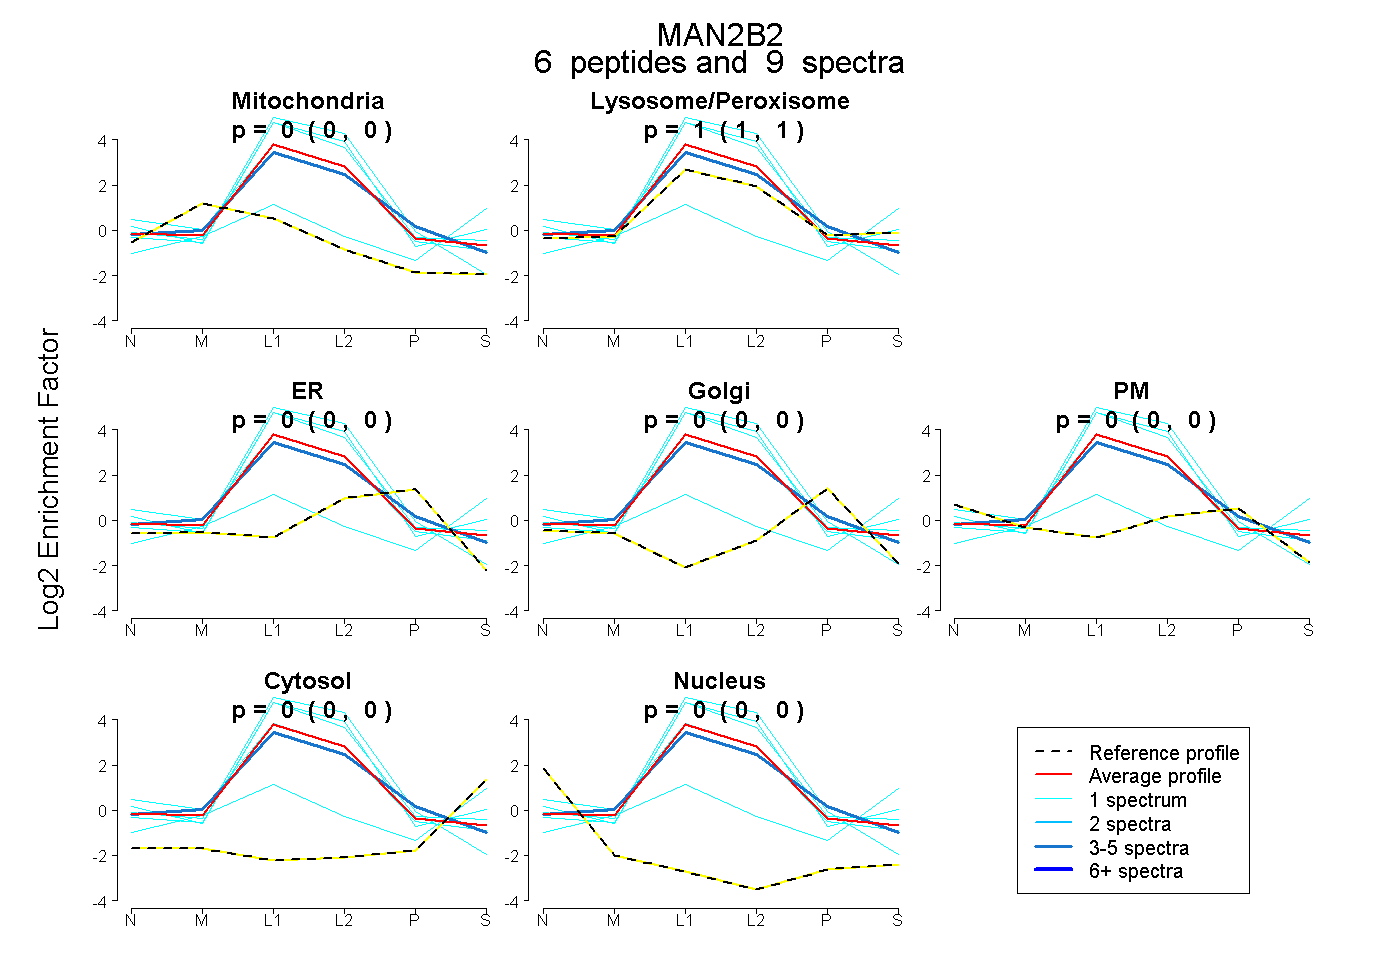 |
0.000 0.000 | 0.000 |
1.000 1.000 | 1.000 |
0.000 0.000 | 0.000 |
0.000 0.000 | 0.000 |
0.000 0.000 | 0.000 |
0.000 0.000 | 0.000 |
0.000 0.000 | 0.000 |
|||
| Plot | Lyso | Other | |||||||||||
| Expt C |
17 peptides |
116 spectra |
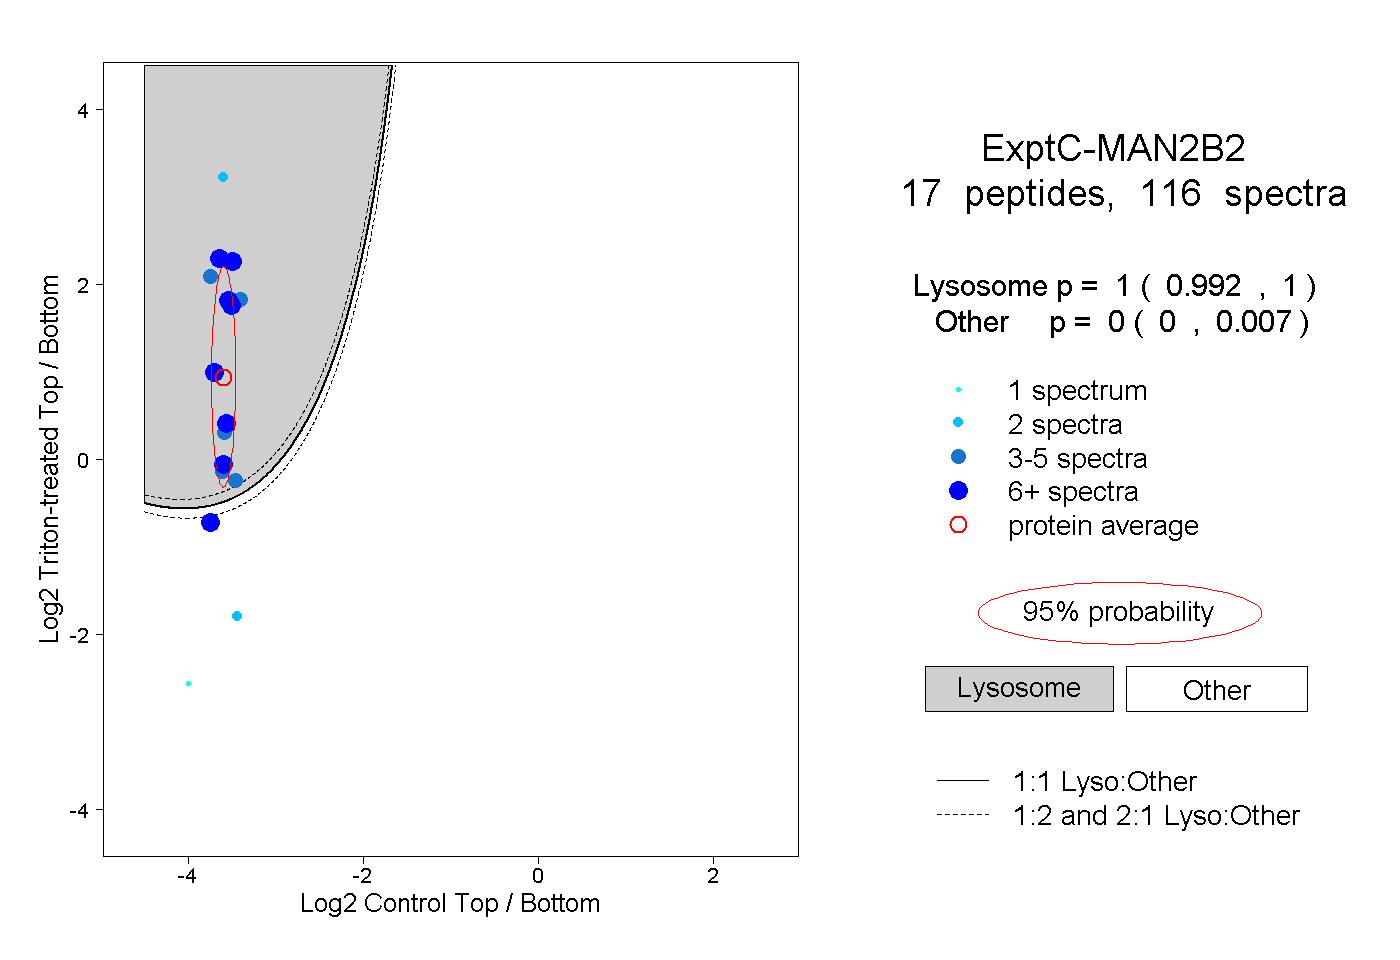 |
1.000 0.992 | 1.000 |
0.000 0.000 | 0.007 |
||||||||
| Plot | Lyso | Other | |||||||||||
| Expt D |
5 peptides |
16 spectra |
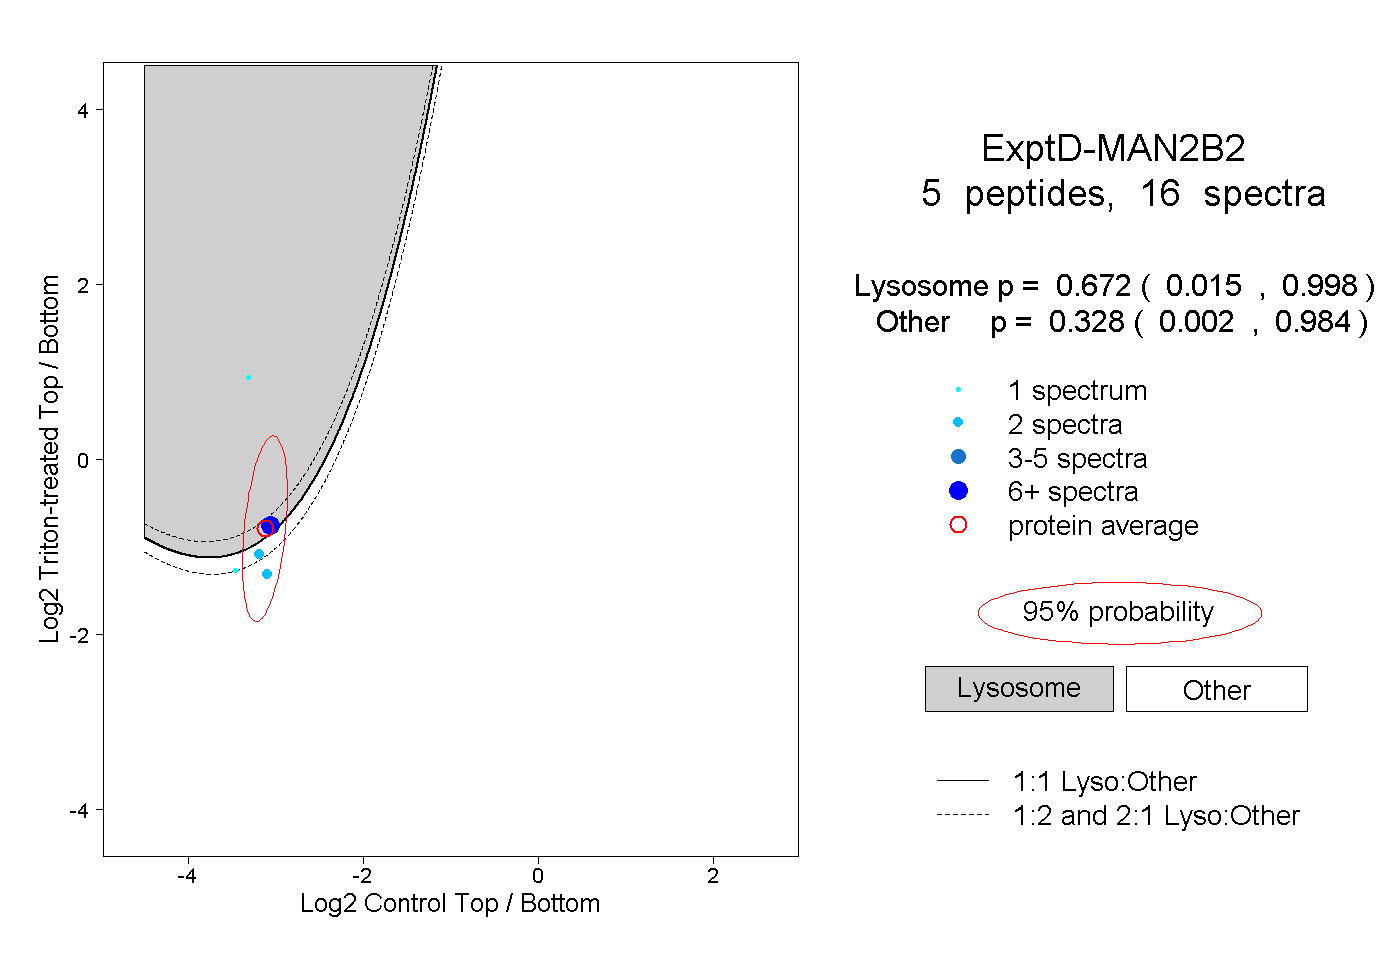 |
0.672 0.015 | 0.998 |
0.328 0.002 | 0.984 |