 2
2peptides
spectra
0.000 | 0.000
0.000 | 0.000
0.000 | 0.080
0.000 | 0.000
0.000 | 0.000
0.209 | 0.330
0.571 | 0.714
0.000 | 0.080
3peptides
spectra
0.000 | 0.000
1.000 | 1.000
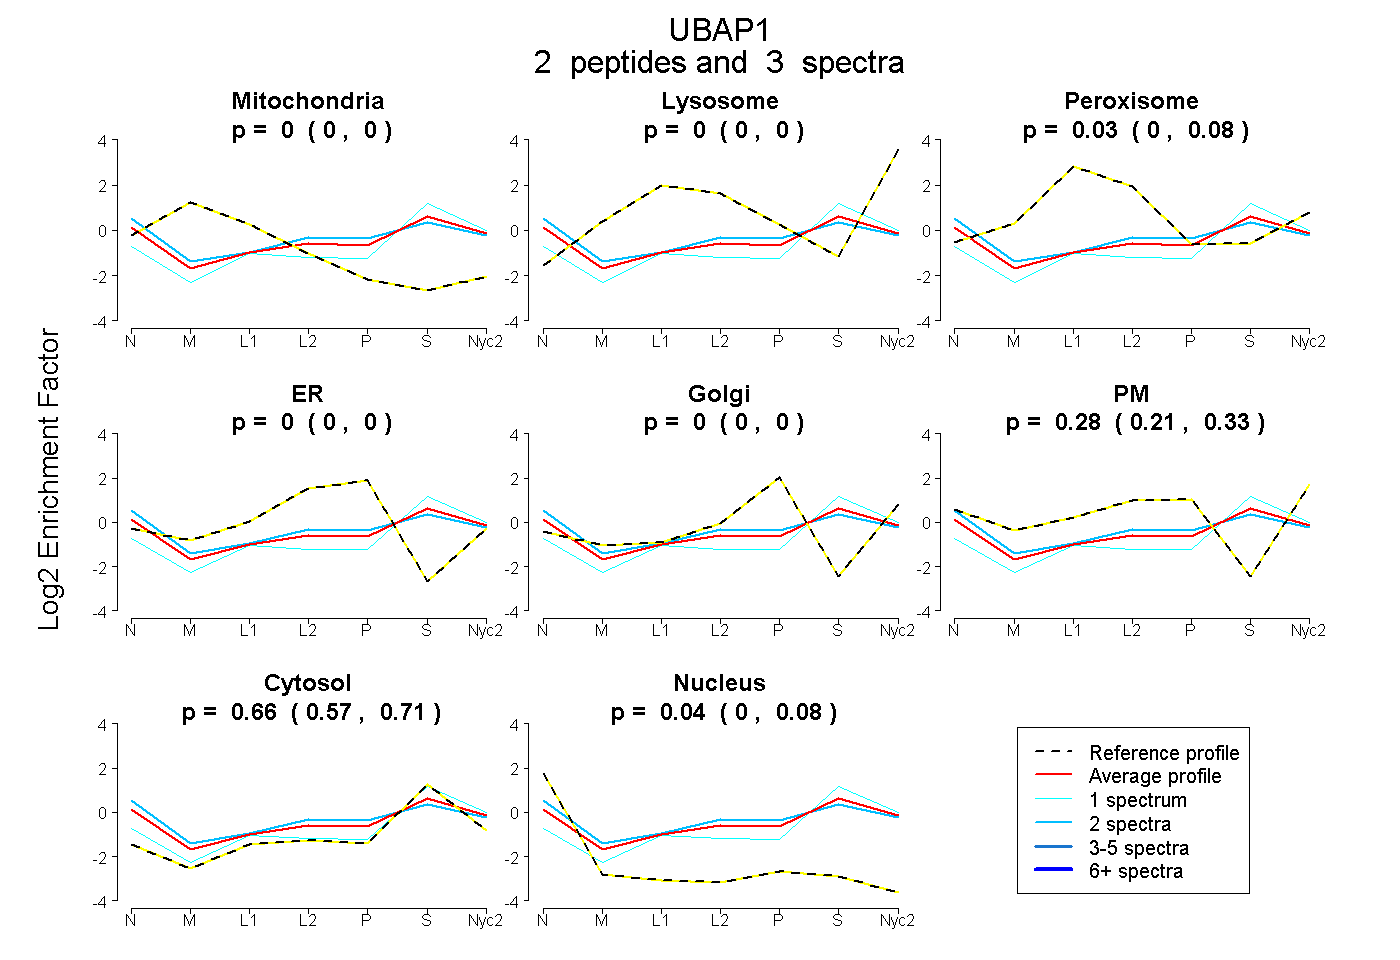
| Plot | Mito | Lyso | Perox | ER | Golgi | PM | Cytosol | Nucleus | |||||
| Expt A |
2 peptides |
3 spectra |
|
0.000 0.000 | 0.000 |
0.000 0.000 | 0.000 |
0.028 0.000 | 0.080 |
0.000 0.000 | 0.000 |
0.000 0.000 | 0.000 |
0.280 0.209 | 0.330 |
0.656 0.571 | 0.714 |
0.035 0.000 | 0.080 |
||
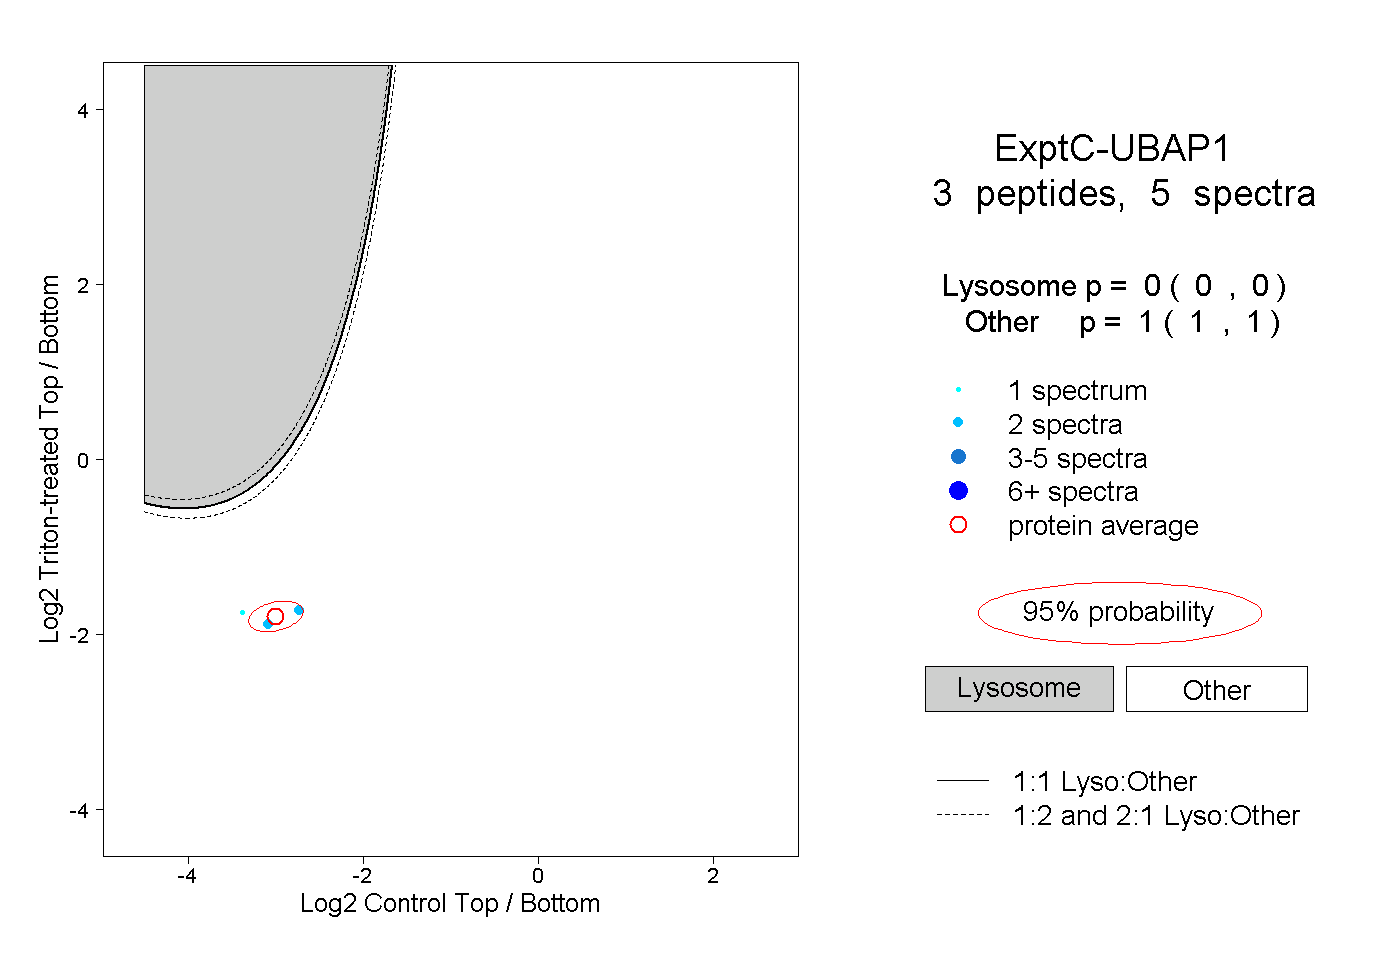
| Plot | Lyso | Other | |||||||||||
| Expt C |
3 peptides |
5 spectra |
|
0.000 0.000 | 0.000 |
1.000 1.000 | 1.000 |