 6
6peptides
spectra
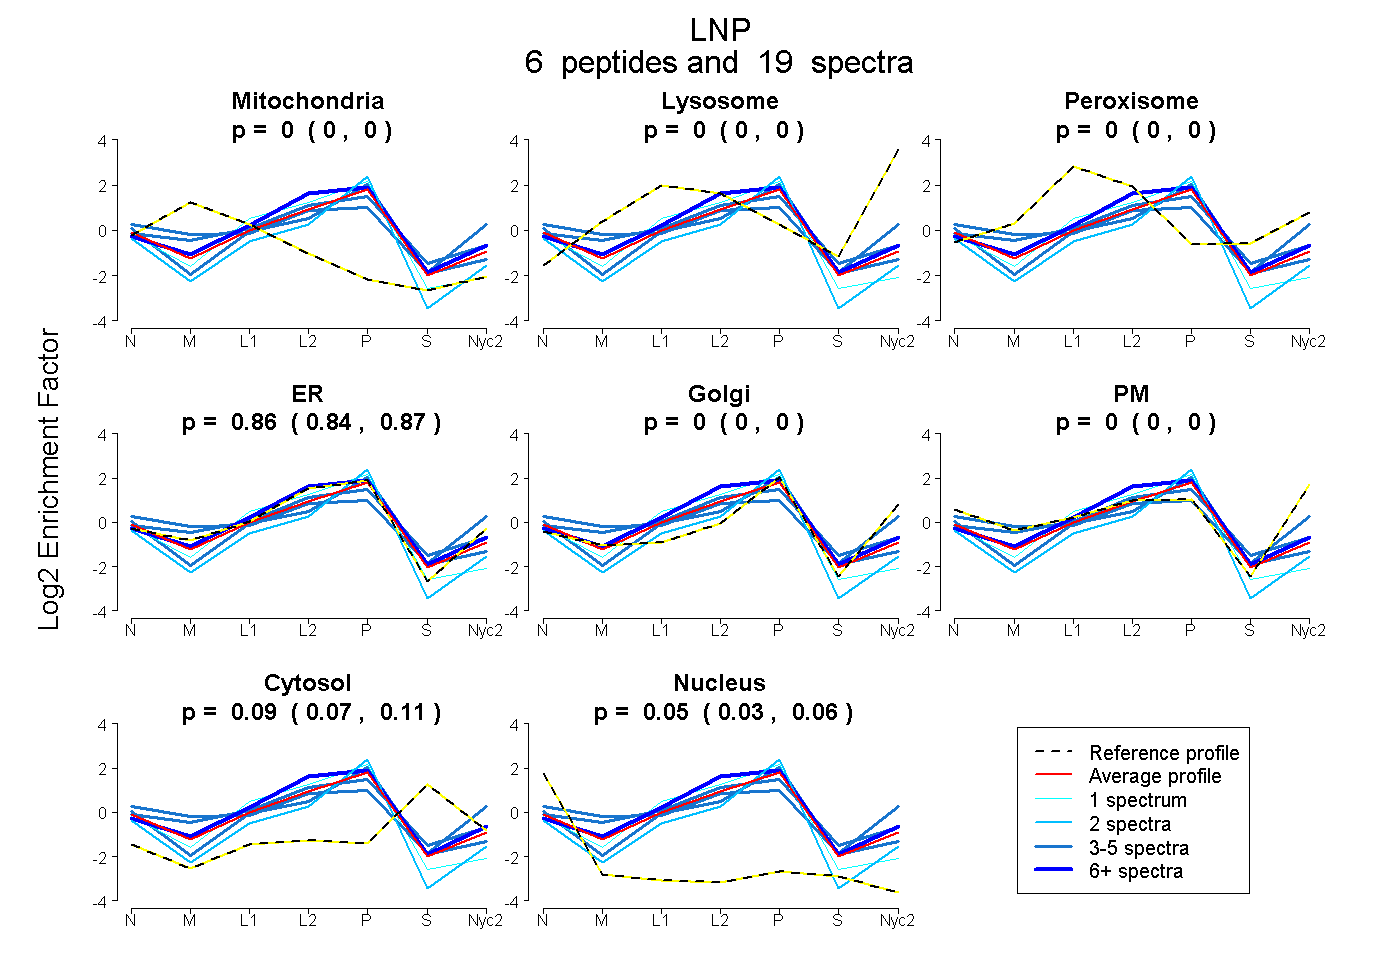
0.000 | 0.000
0.000 | 0.000
0.000 | 0.000
0.844 | 0.872
0.000 | 0.000
0.000 | 0.000
0.071 | 0.110
0.033 | 0.061
| Plot | Mito | Lyso | Perox | ER | Golgi | PM | Cytosol | Nucleus | |||||
| Expt A |
6 peptides |
19 spectra |
|
0.000 0.000 | 0.000 |
0.000 0.000 | 0.000 |
0.000 0.000 | 0.000 |
0.859 0.844 | 0.872 |
0.000 0.000 | 0.000 |
0.000 0.000 | 0.000 |
0.092 0.071 | 0.110 |
0.049 0.033 | 0.061 |
| 3 spectra, ILEEVMEK | 0.038 | 0.000 | 0.084 | 0.751 | 0.000 | 0.000 | 0.127 | 0.000 | ||
| 6 spectra, NNEALDDLK | 0.000 | 0.000 | 0.036 | 0.893 | 0.000 | 0.000 | 0.070 | 0.000 | ||
| 1 spectrum, EFEPPSAGAAATAKPGQEIR | 0.000 | 0.000 | 0.000 | 0.907 | 0.000 | 0.000 | 0.000 | 0.093 | ||
| 2 spectra, TVAPALPR | 0.000 | 0.000 | 0.000 | 0.759 | 0.072 | 0.000 | 0.000 | 0.169 | ||
| 4 spectra, DASAPGGPPER | 0.000 | 0.000 | 0.000 | 0.793 | 0.000 | 0.000 | 0.105 | 0.102 | ||
| 3 spectra, GGLFSR | 0.101 | 0.000 | 0.013 | 0.362 | 0.000 | 0.438 | 0.086 | 0.000 |
| Plot | Mito | Lyso or Perox | ER | Golgi | PM | Cytosol | Nucleus | ||||||
| Expt B |
5 peptides |
8 spectra |
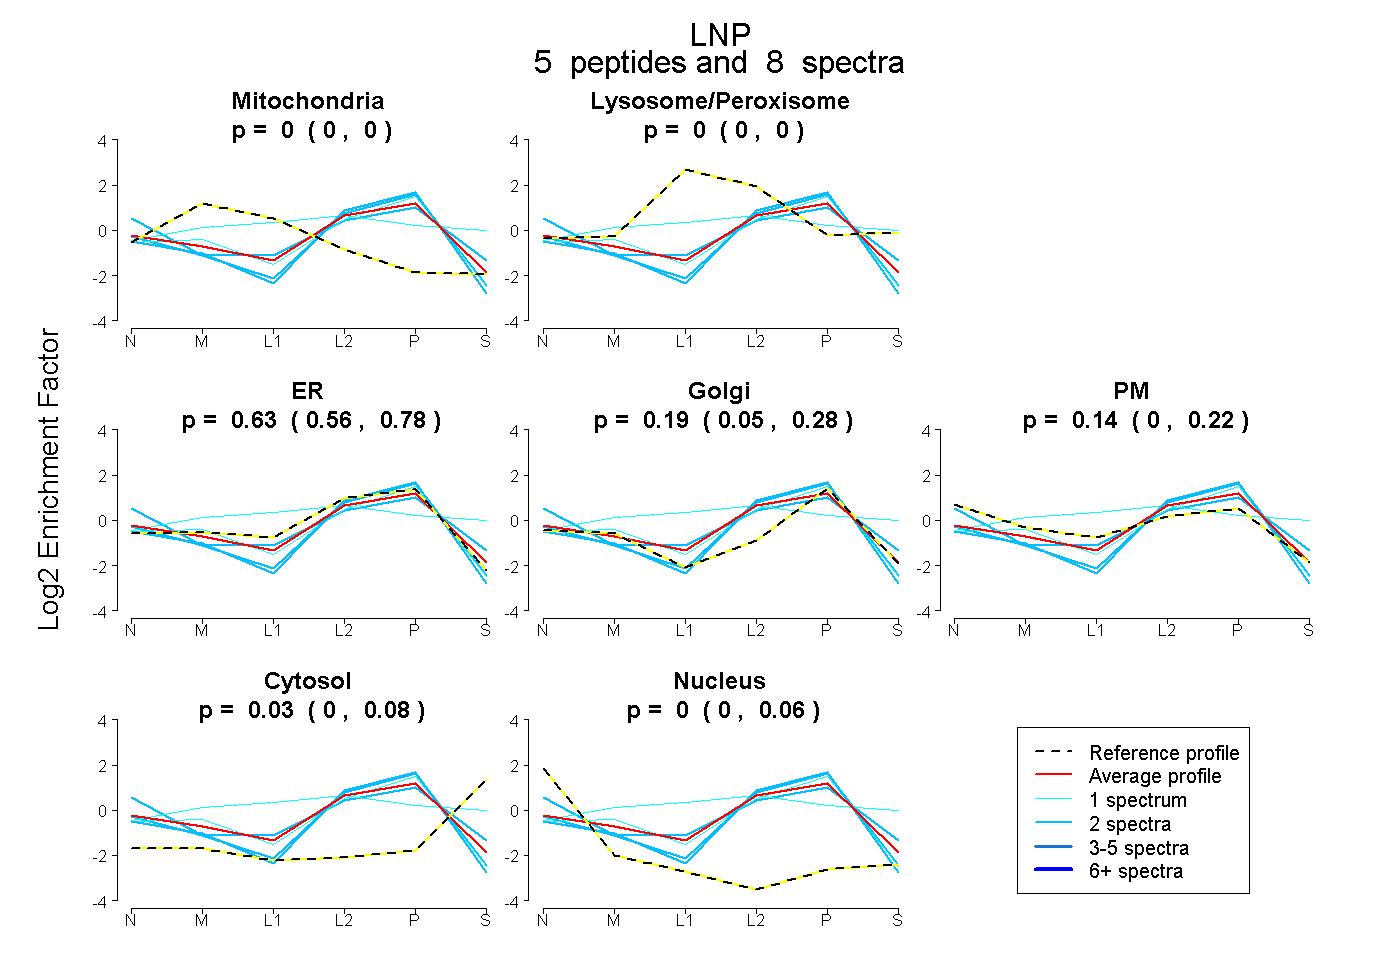 |
0.000 0.000 | 0.000 |
0.000 0.000 | 0.000 |
0.633 0.558 | 0.777 |
0.190 0.048 | 0.280 |
0.142 0.000 | 0.217 |
0.035 0.000 | 0.078 |
0.000 0.000 | 0.055 |
|||
| Plot | Lyso | Other | |||||||||||
| Expt C |
10 peptides |
27 spectra |
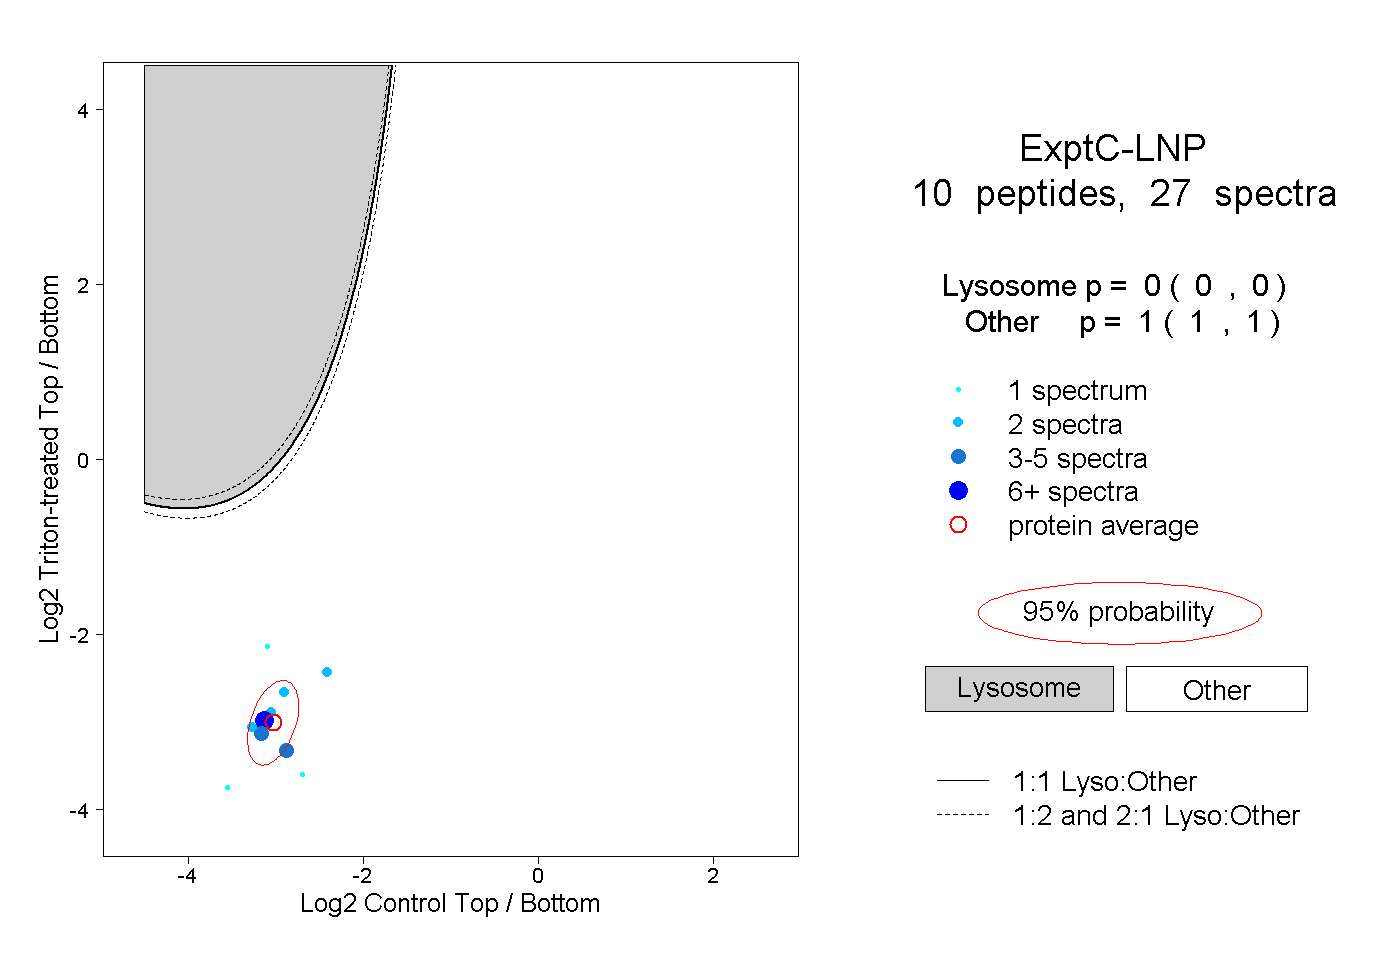 |
0.000 0.000 | 0.000 |
1.000 1.000 | 1.000 |
||||||||
| Plot | Lyso | Other | |||||||||||
| Expt D |
2 peptides |
2 spectra |
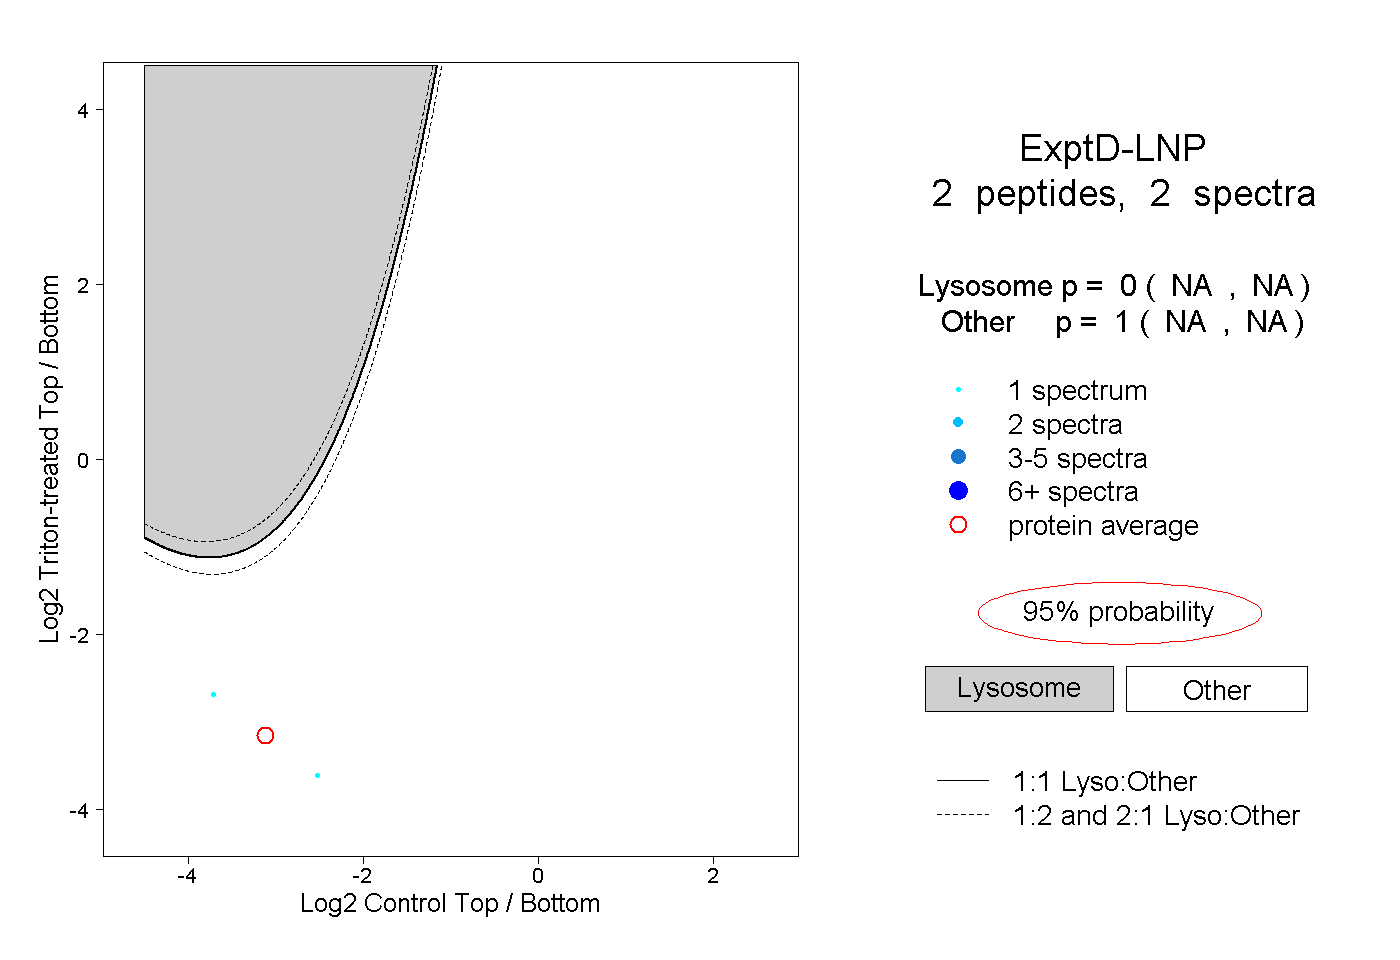 |
0.000 NA | NA |
1.000 NA | NA |