11
11peptides
spectra
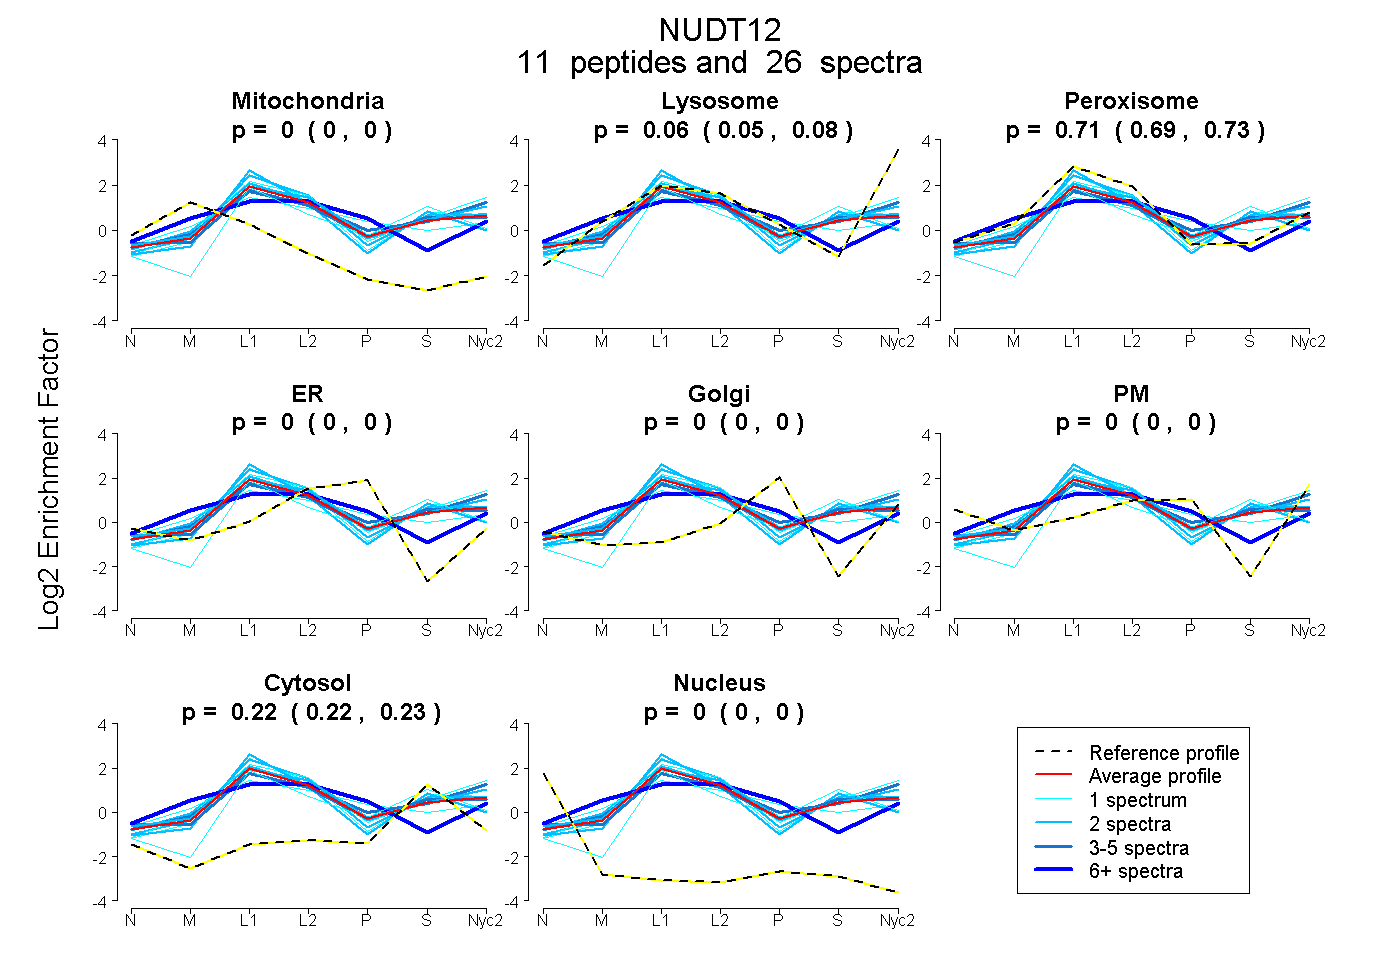
0.000 | 0.000
0.048 | 0.077
0.695 | 0.726
0.000 | 0.000
0.000 | 0.000
0.000 | 0.000
0.216 | 0.231
0.000 | 0.000
6peptides
spectra
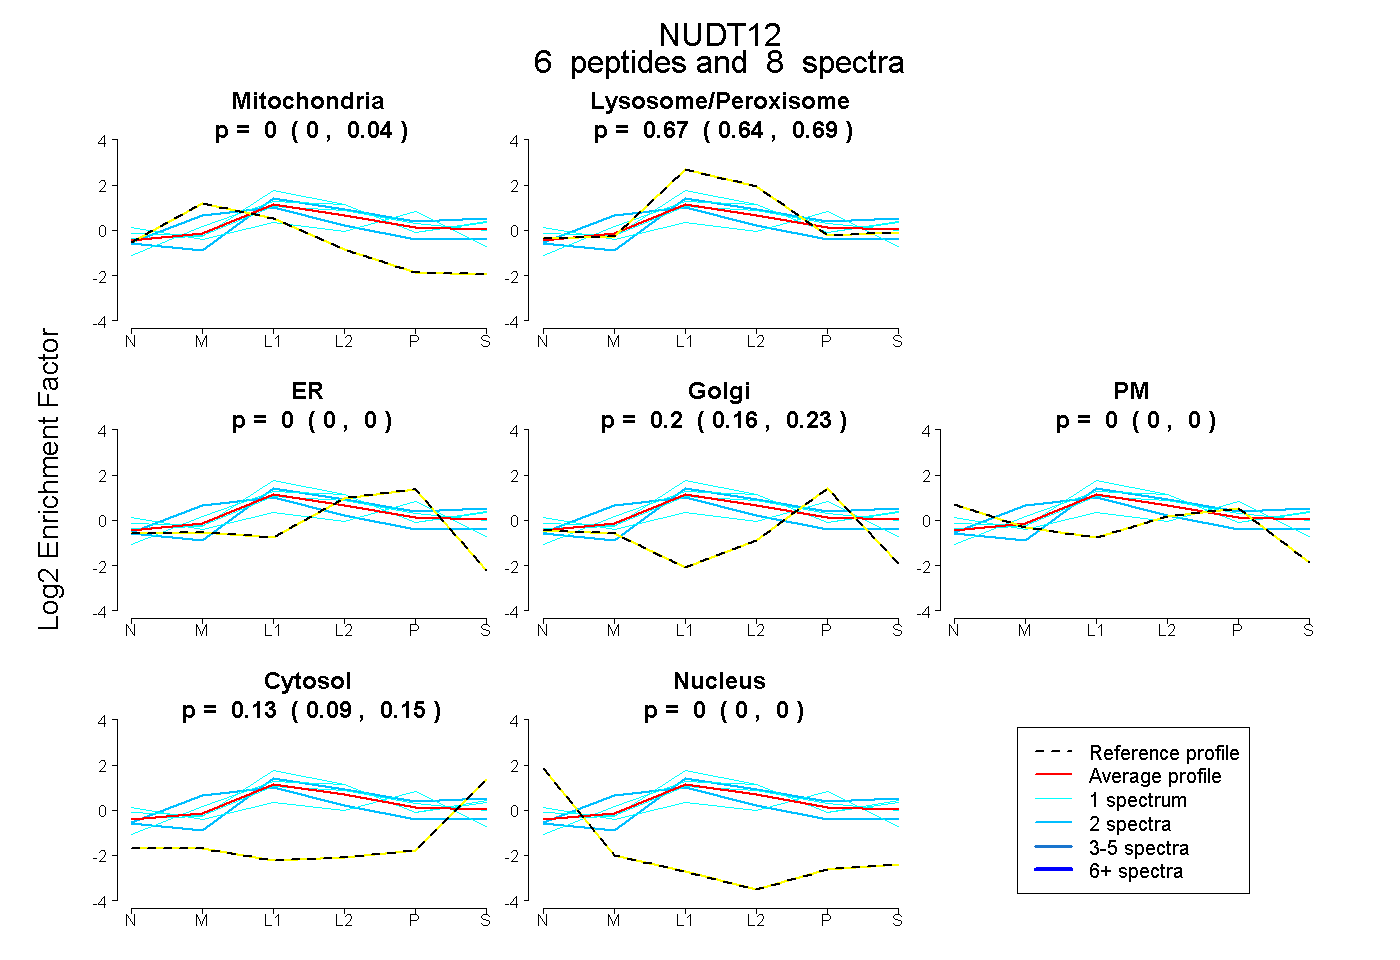
0.000 | 0.043
0.637 | 0.688
0.000 | 0.000
0.160 | 0.226
0.000 | 0.005
0.095 | 0.151
0.000 | 0.000