 11
11peptides
spectra
0.000 | 0.000
0.048 | 0.077
0.695 | 0.726
0.000 | 0.000
0.000 | 0.000
0.000 | 0.000
0.216 | 0.231
0.000 | 0.000
| Plot | Mito | Lyso | Perox | ER | Golgi | PM | Cytosol | Nucleus | |||||
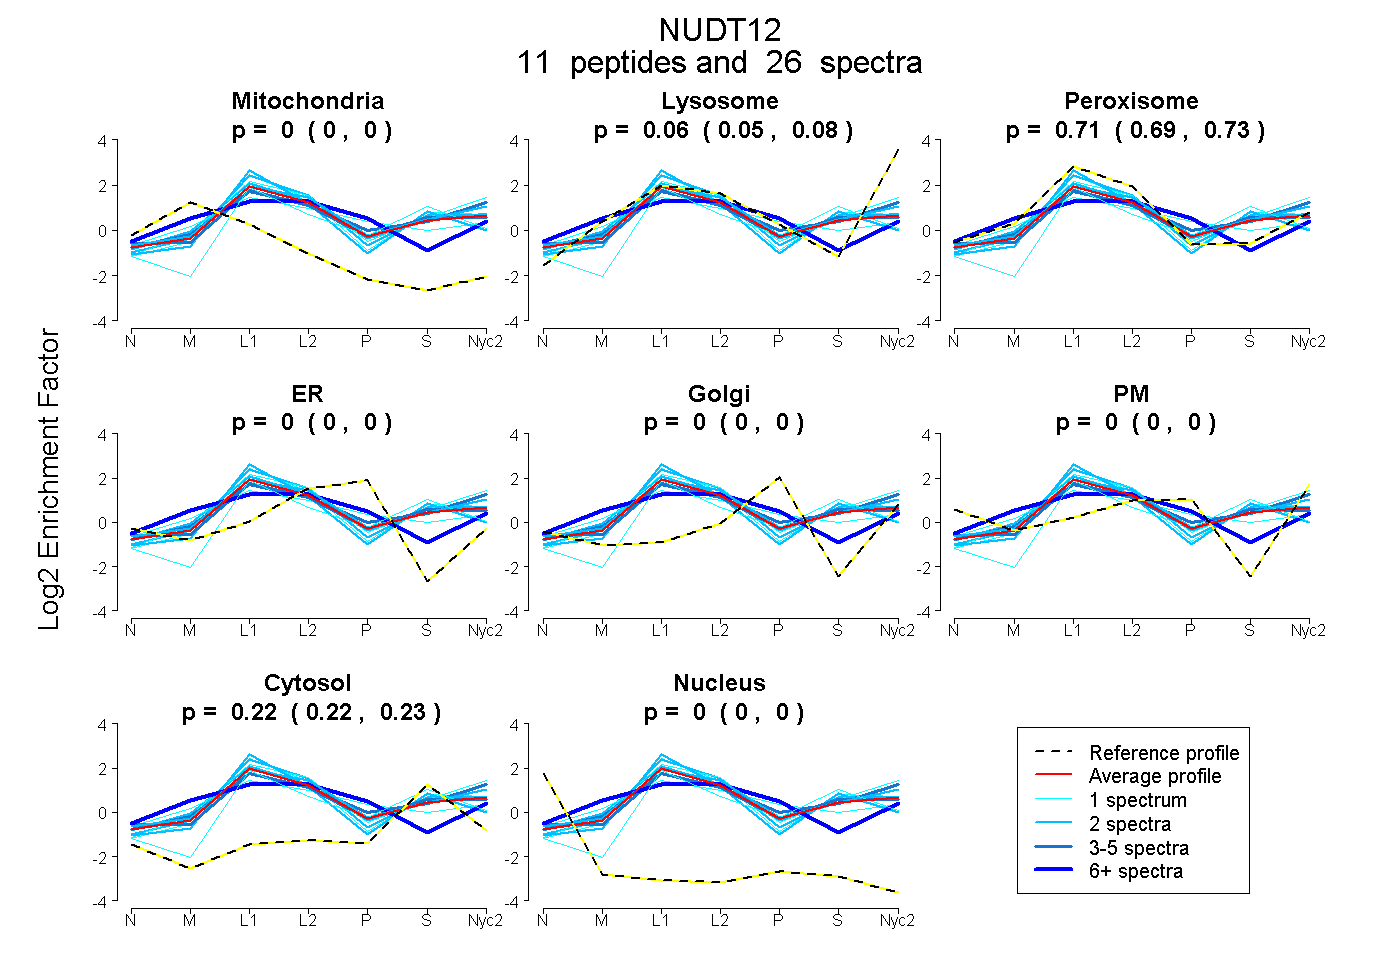
| Expt A |
11 peptides |
26 spectra |
|
0.000 0.000 | 0.000 |
0.064 0.048 | 0.077 |
0.712 0.695 | 0.726 |
0.000 0.000 | 0.000 |
0.000 0.000 | 0.000 |
0.000 0.000 | 0.000 |
0.224 0.216 | 0.231 |
0.000 0.000 | 0.000 |
| 4 spectra, QQAFFVPPSR | 0.000 | 0.034 | 0.700 | 0.000 | 0.000 | 0.000 | 0.267 | 0.000 | ||
| 1 spectrum, EQVVDVLTK | 0.000 | 0.003 | 0.790 | 0.000 | 0.000 | 0.000 | 0.207 | 0.000 | ||
| 2 spectra, EAGVVAQAR | 0.000 | 0.069 | 0.738 | 0.000 | 0.000 | 0.000 | 0.193 | 0.000 | ||
| 2 spectra, ESSQQPEVR | 0.000 | 0.000 | 0.822 | 0.000 | 0.000 | 0.000 | 0.178 | 0.000 | ||
| 1 spectrum, VDPVVIMQVIHPDGTK | 0.000 | 0.000 | 0.570 | 0.000 | 0.000 | 0.000 | 0.430 | 0.000 | ||
| 4 spectra, HWVGMNPSL | 0.000 | 0.269 | 0.512 | 0.000 | 0.000 | 0.000 | 0.219 | 0.000 | ||
| 2 spectra, KPWFLTSDVDGCENYFSR | 0.000 | 0.000 | 0.755 | 0.000 | 0.000 | 0.000 | 0.245 | 0.000 | ||
| 2 spectra, TNSDWLQAK | 0.000 | 0.150 | 0.658 | 0.000 | 0.000 | 0.000 | 0.192 | 0.000 | ||
| 6 spectra, SVLAWHSR | 0.064 | 0.000 | 0.600 | 0.085 | 0.251 | 0.000 | 0.000 | 0.000 | ||
| 1 spectrum, EVGEESGVK | 0.000 | 0.252 | 0.590 | 0.000 | 0.000 | 0.000 | 0.159 | 0.000 | ||
| 1 spectrum, HIANLLANAK | 0.000 | 0.000 | 0.662 | 0.000 | 0.190 | 0.000 | 0.148 | 0.000 |
| Plot | Mito | Lyso or Perox | ER | Golgi | PM | Cytosol | Nucleus | ||||||
| Expt B |
6 peptides |
8 spectra |
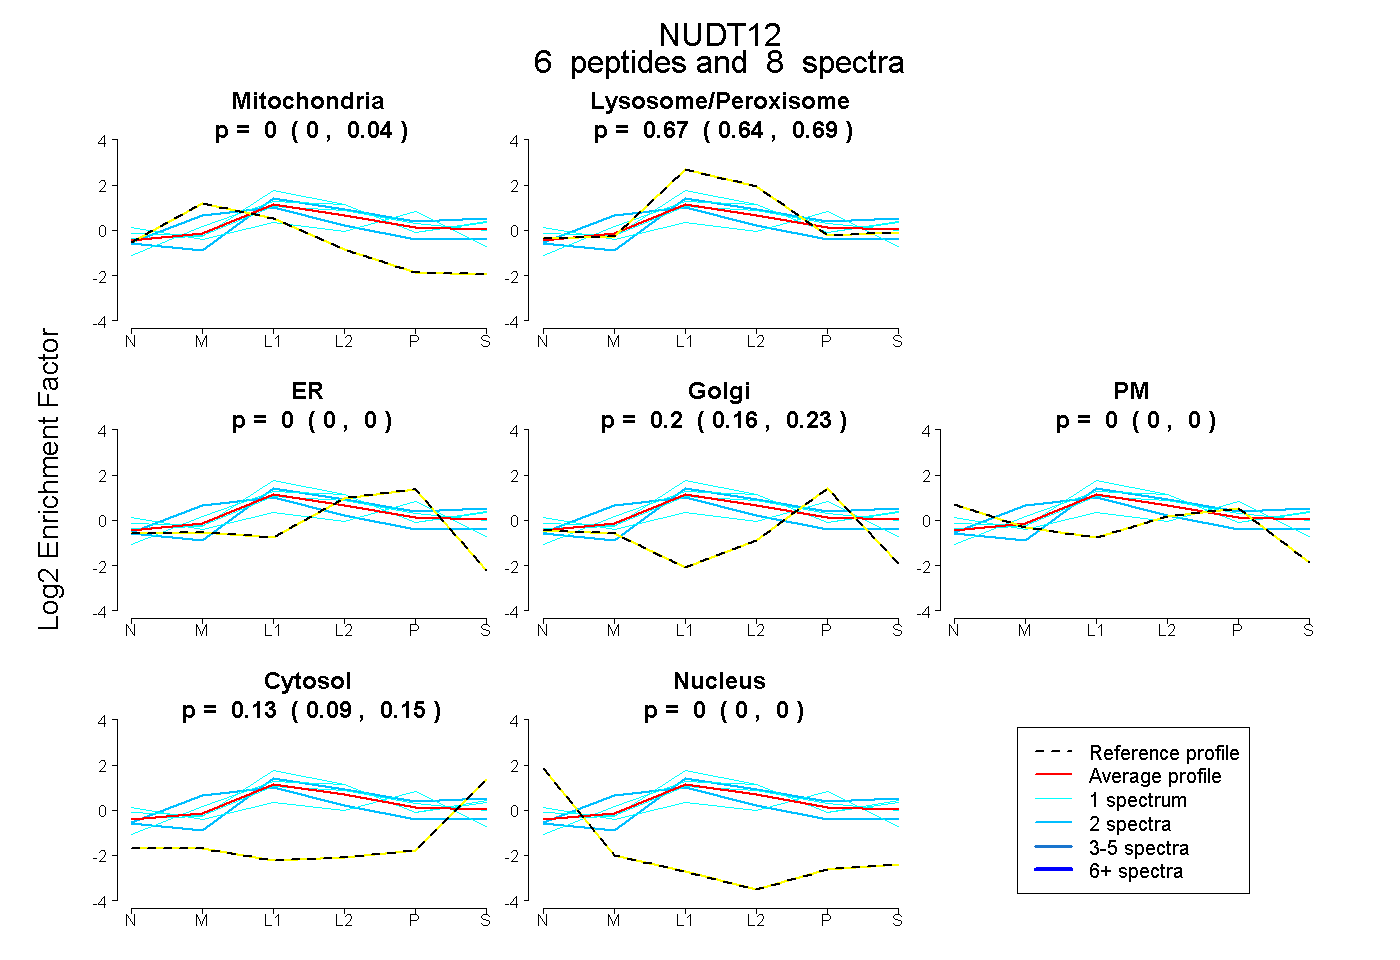 |
0.004 0.000 | 0.043 |
0.669 0.637 | 0.688 |
0.000 0.000 | 0.000 |
0.202 0.160 | 0.226 |
0.000 0.000 | 0.005 |
0.126 0.095 | 0.151 |
0.000 0.000 | 0.000 |
|||
| Plot | Lyso | Other | |||||||||||
| Expt C |
14 peptides |
69 spectra |
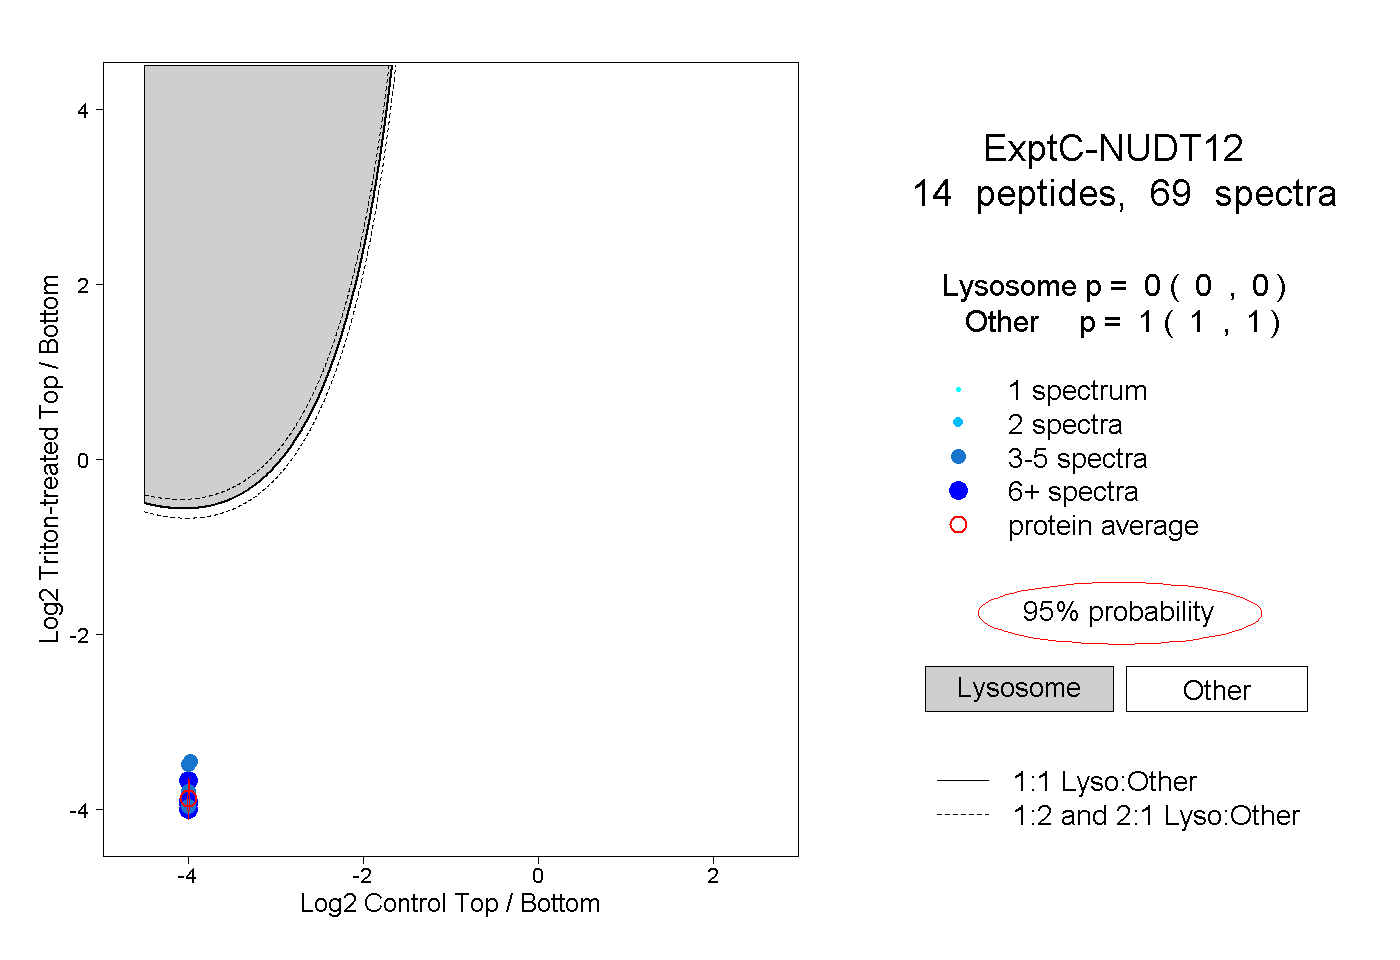 |
0.000 0.000 | 0.000 |
1.000 1.000 | 1.000 |
||||||||
| Plot | Lyso | Other | |||||||||||
| Expt D |
6 peptides |
10 spectra |
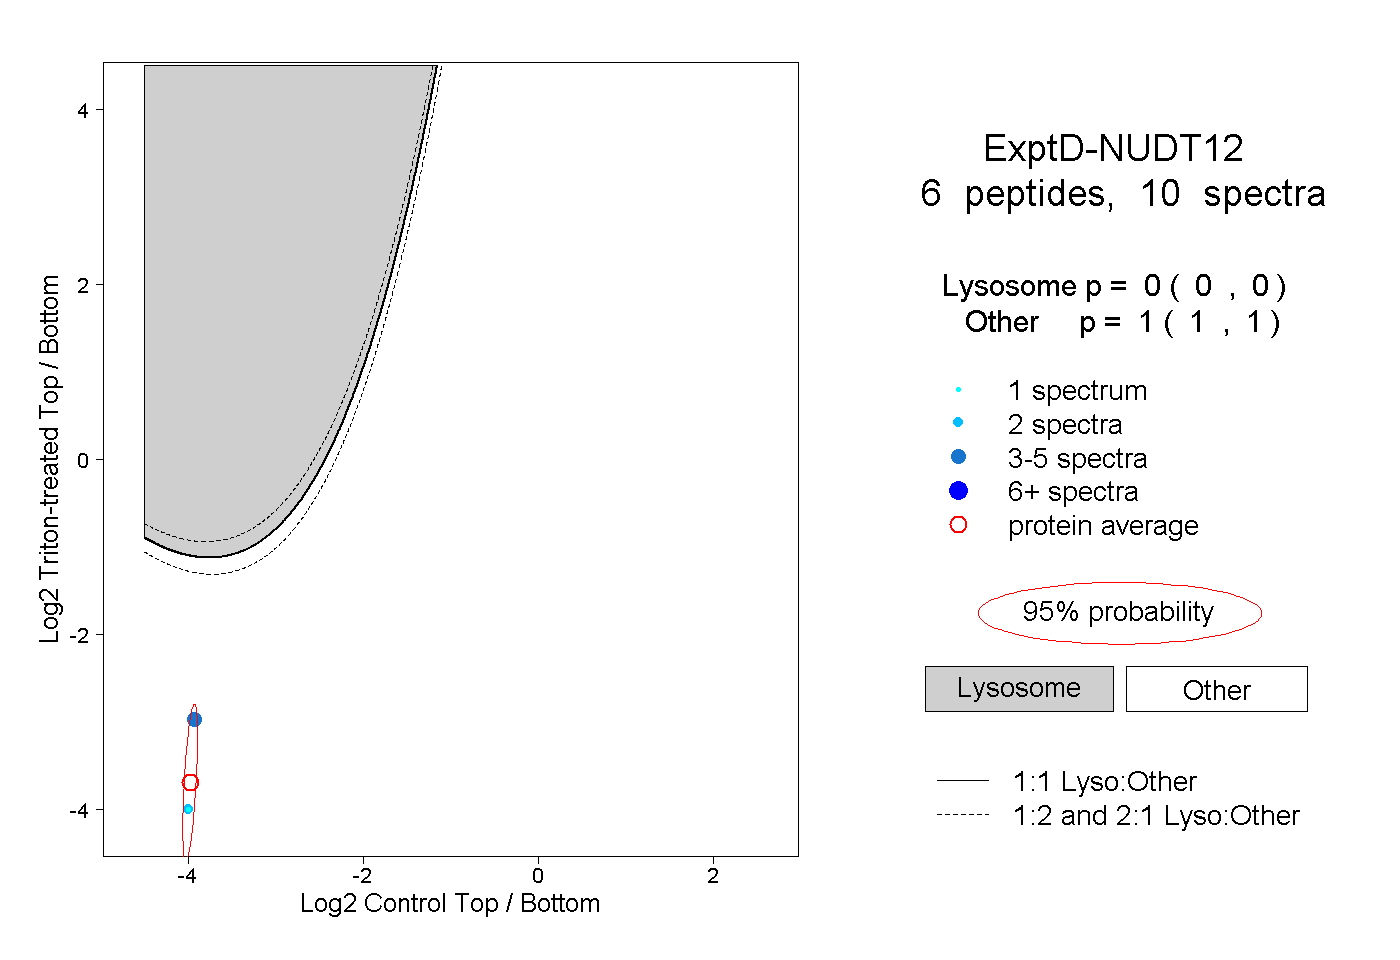 |
0.000 0.000 | 0.000 |
1.000 1.000 | 1.000 |