 2
2peptides
spectra
0.024 | 0.216
0.000 | 0.000
0.000 | 0.037
0.679 | 0.880
0.000 | 0.000
0.000 | 0.000
0.000 | 0.064
0.012 | 0.097
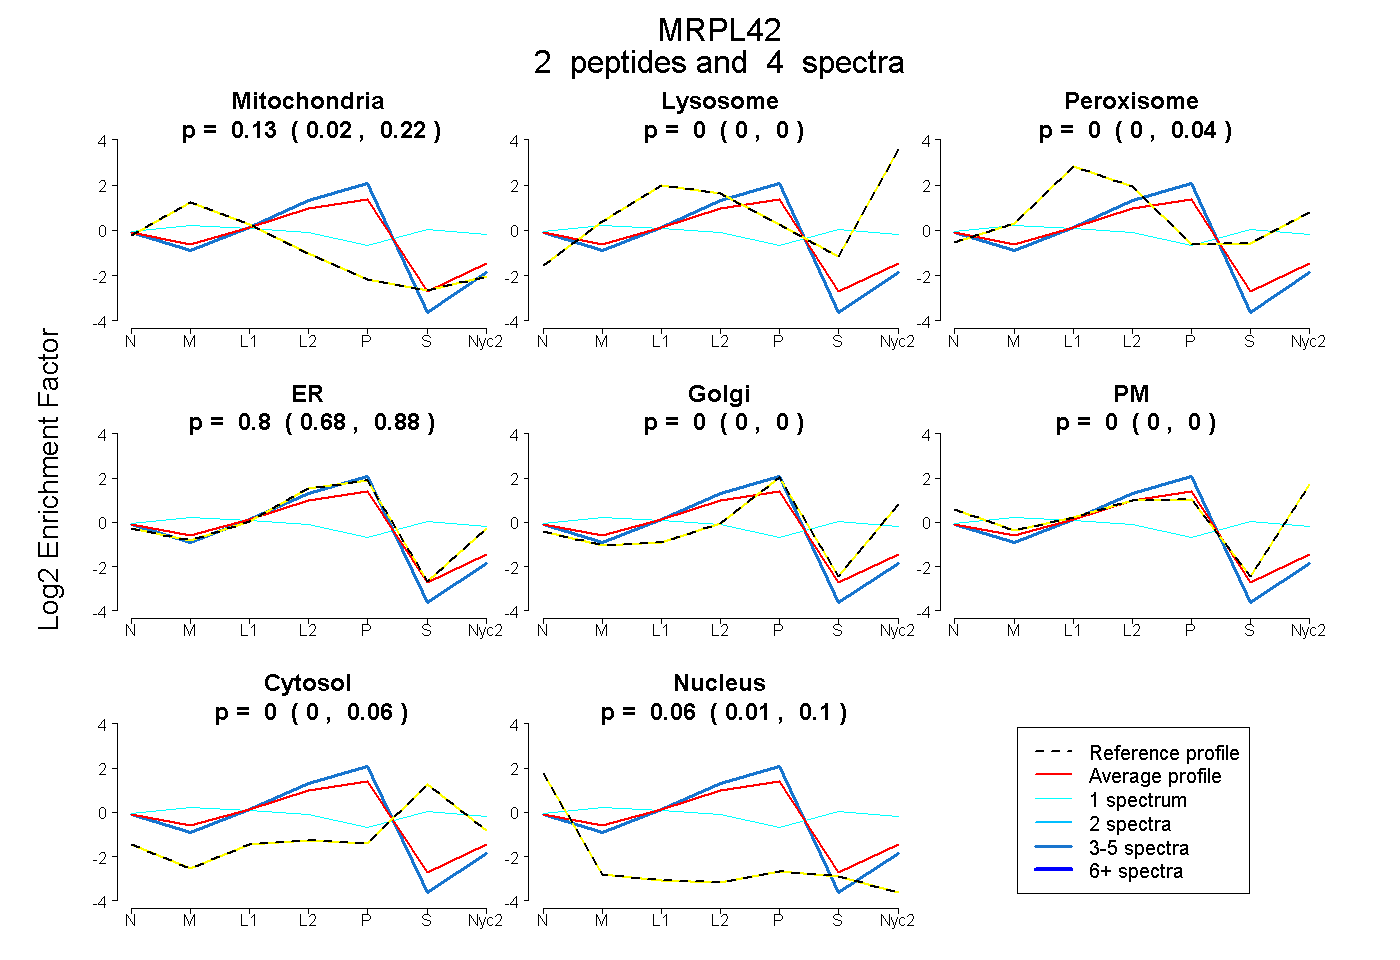
| Plot | Mito | Lyso | Perox | ER | Golgi | PM | Cytosol | Nucleus | |||||
| Expt A |
2 peptides |
4 spectra |
|
0.135 0.024 | 0.216 |
0.000 0.000 | 0.000 |
0.000 0.000 | 0.037 |
0.802 0.679 | 0.880 |
0.000 0.000 | 0.000 |
0.000 0.000 | 0.000 |
0.000 0.000 | 0.064 |
0.063 0.012 | 0.097 |
| 1 spectrum, HLEQGPMIEQLSK | 0.215 | 0.000 | 0.281 | 0.000 | 0.000 | 0.163 | 0.341 | 0.000 | ||
| 3 spectra, AAAVK | 0.000 | 0.000 | 0.000 | 0.913 | 0.000 | 0.000 | 0.000 | 0.087 |
| Plot | Lyso | Other | |||||||||||
| Expt C |
3 peptides |
16 spectra |
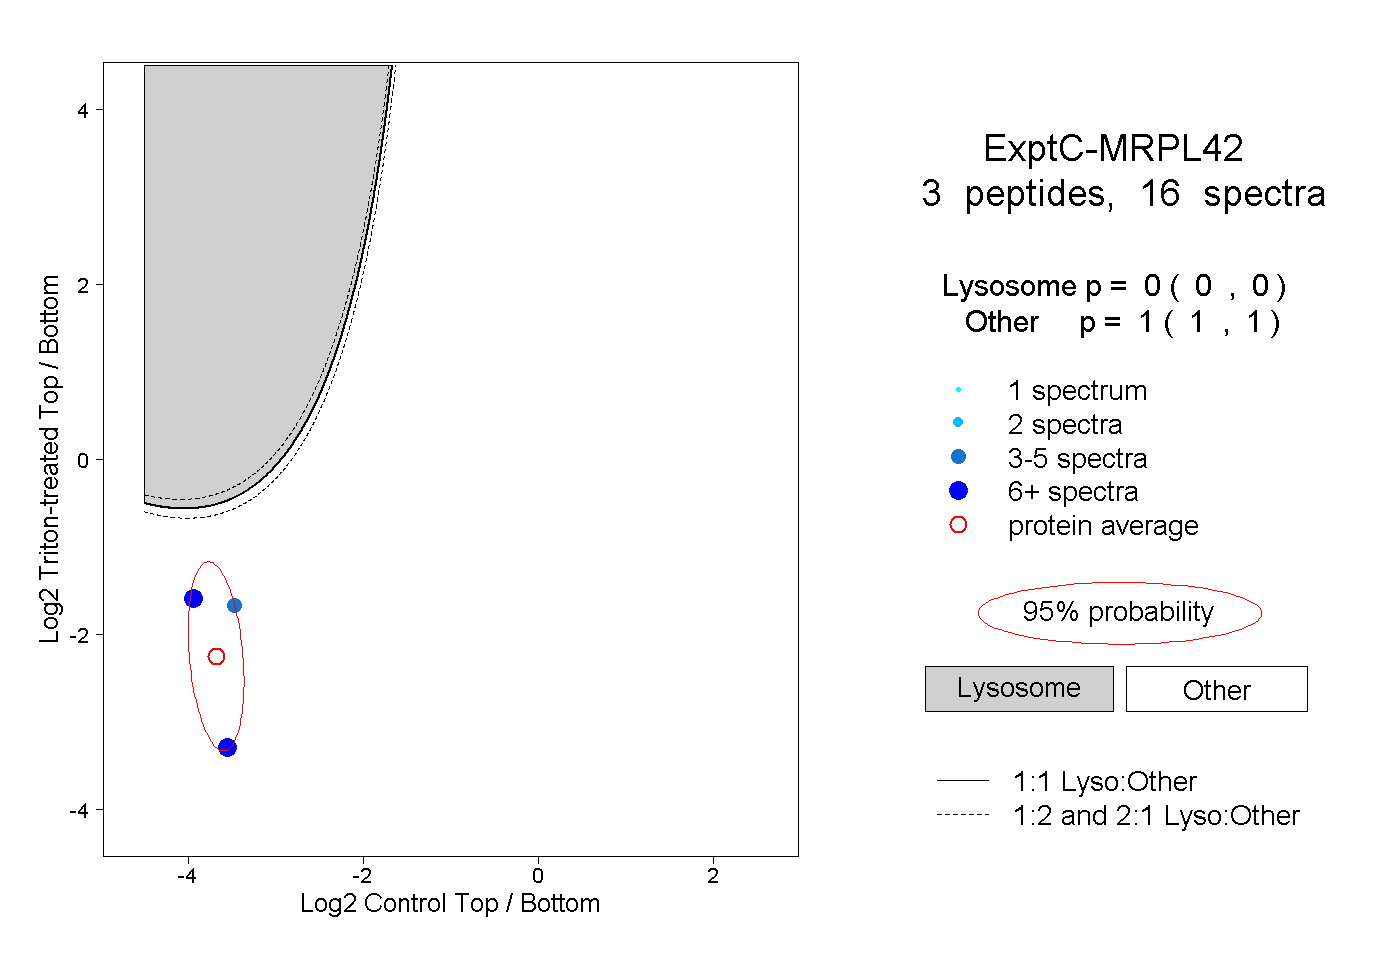 |
0.000 0.000 | 0.000 |
1.000 1.000 | 1.000 |