 3
3peptides
spectra
0.000 | 0.025
0.000 | 0.000
0.000 | 0.141
0.000 | 0.232
0.000 | 0.182
0.000 | 0.507
0.000 | 0.252
0.304 | 0.533
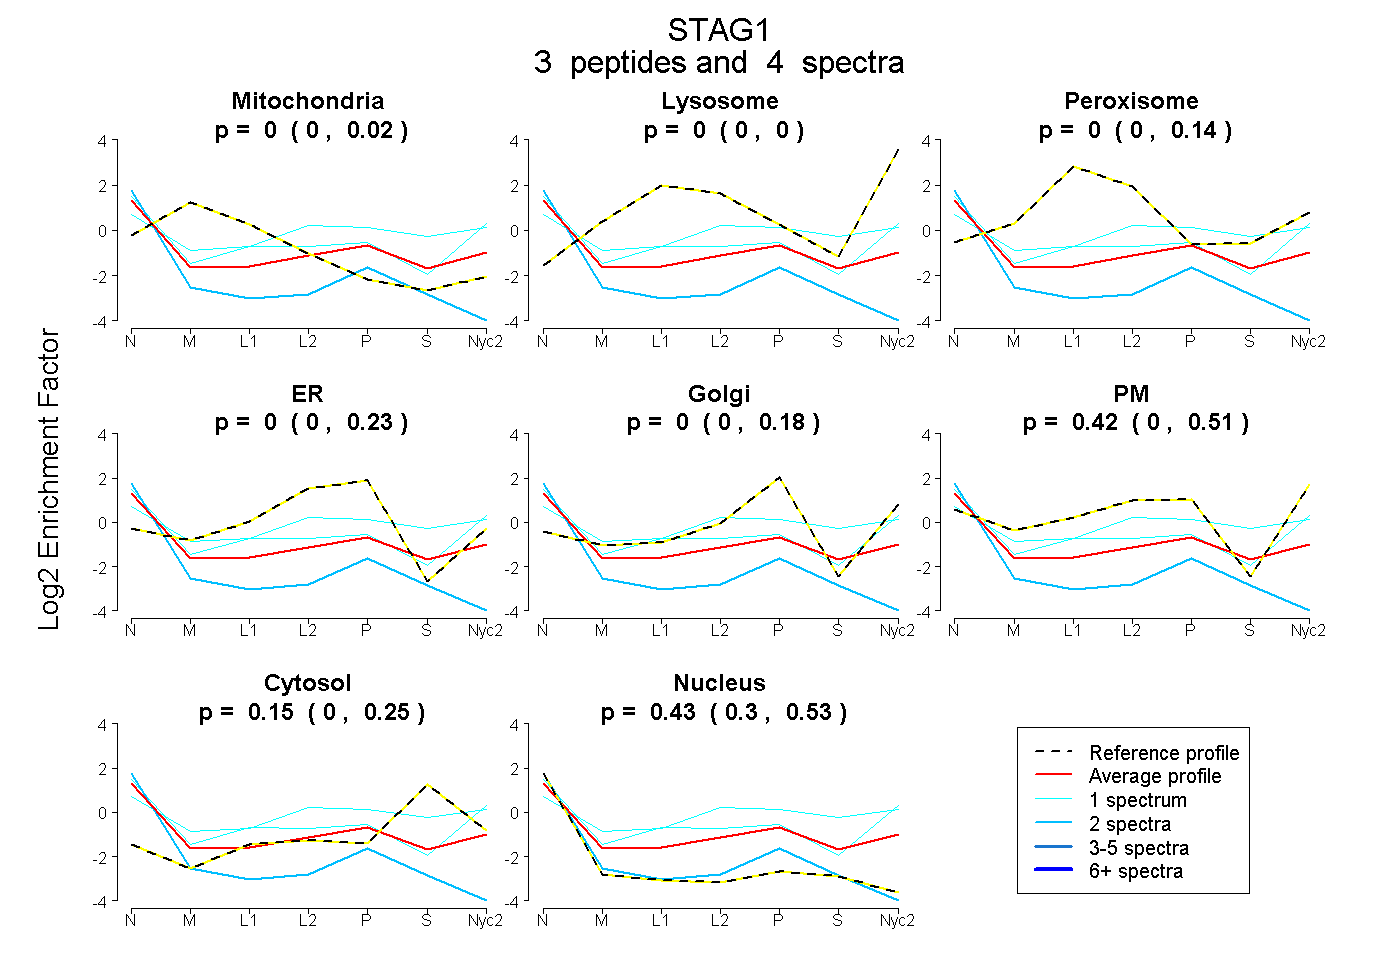
| Plot | Mito | Lyso | Perox | ER | Golgi | PM | Cytosol | Nucleus | |||||
| Expt A |
3 peptides |
4 spectra |
|
0.000 0.000 | 0.025 |
0.000 0.000 | 0.000 |
0.000 0.000 | 0.141 |
0.000 0.000 | 0.232 |
0.000 0.000 | 0.182 |
0.422 0.000 | 0.507 |
0.148 0.000 | 0.252 |
0.430 0.304 | 0.533 |