 58
58peptides
spectra
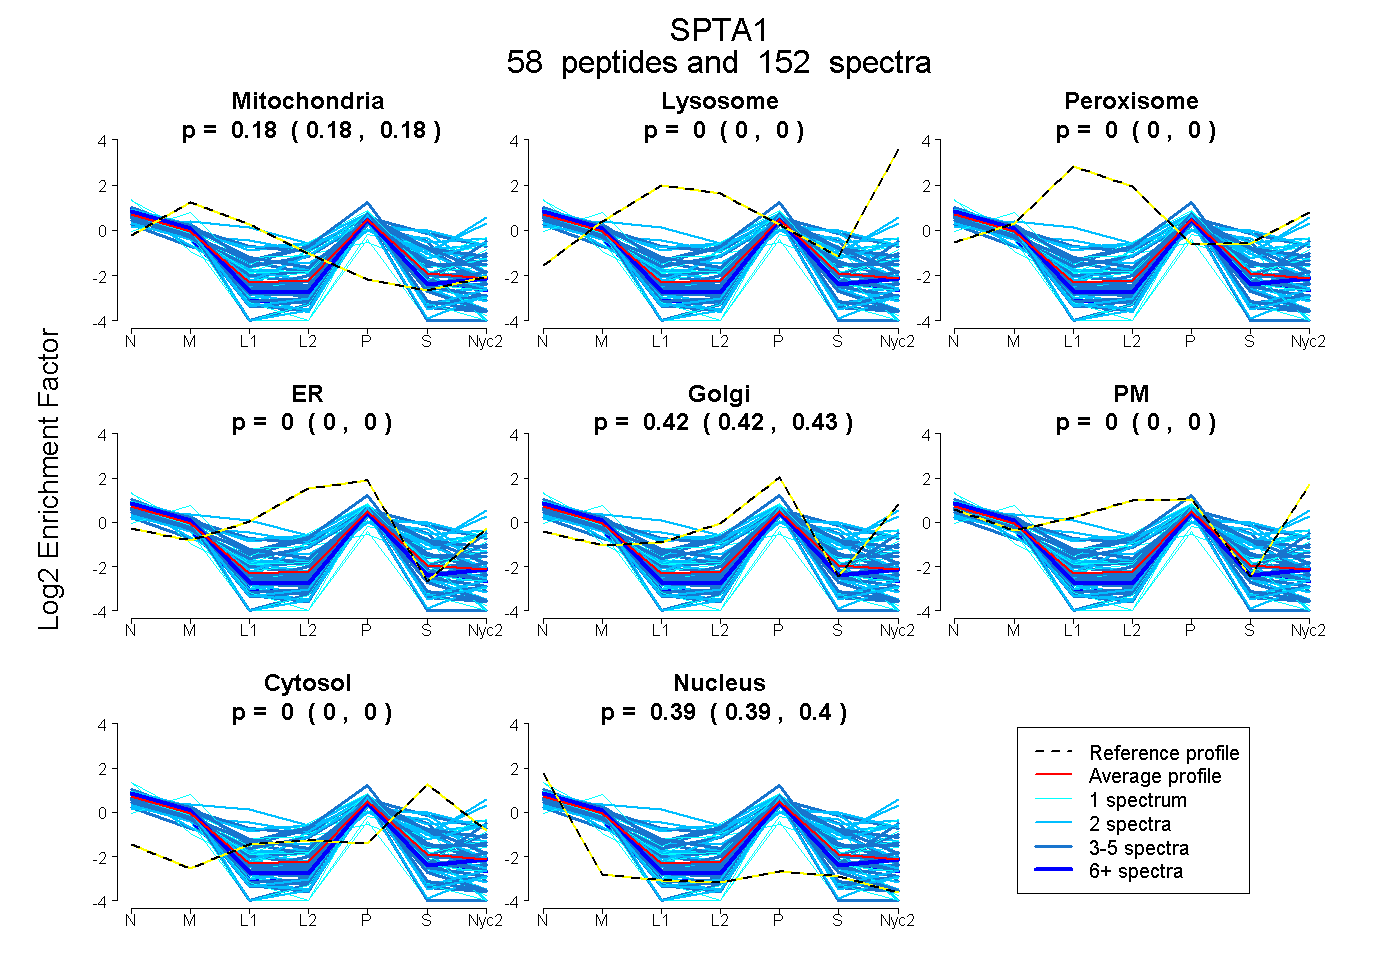
0.179 | 0.184
0.000 | 0.000
0.000 | 0.000
0.000 | 0.000
0.421 | 0.426
0.000 | 0.000
0.000 | 0.000
0.392 | 0.397
14peptides
spectra
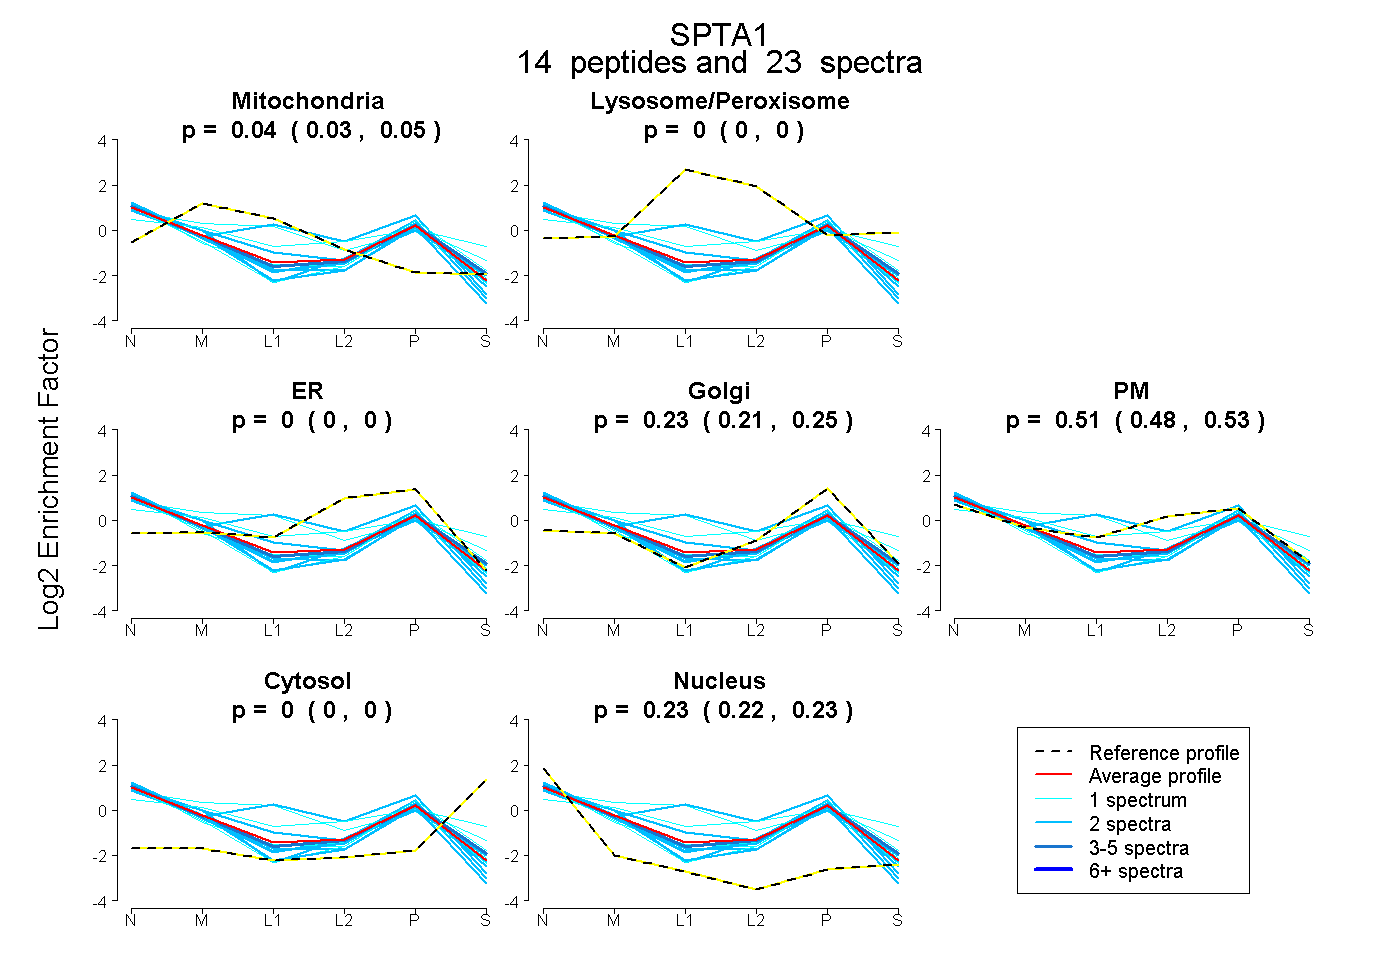
0.025 | 0.047
0.000 | 0.000
0.000 | 0.000
0.211 | 0.247
0.483 | 0.525
0.000 | 0.000
0.218 | 0.232
7peptides
spectra
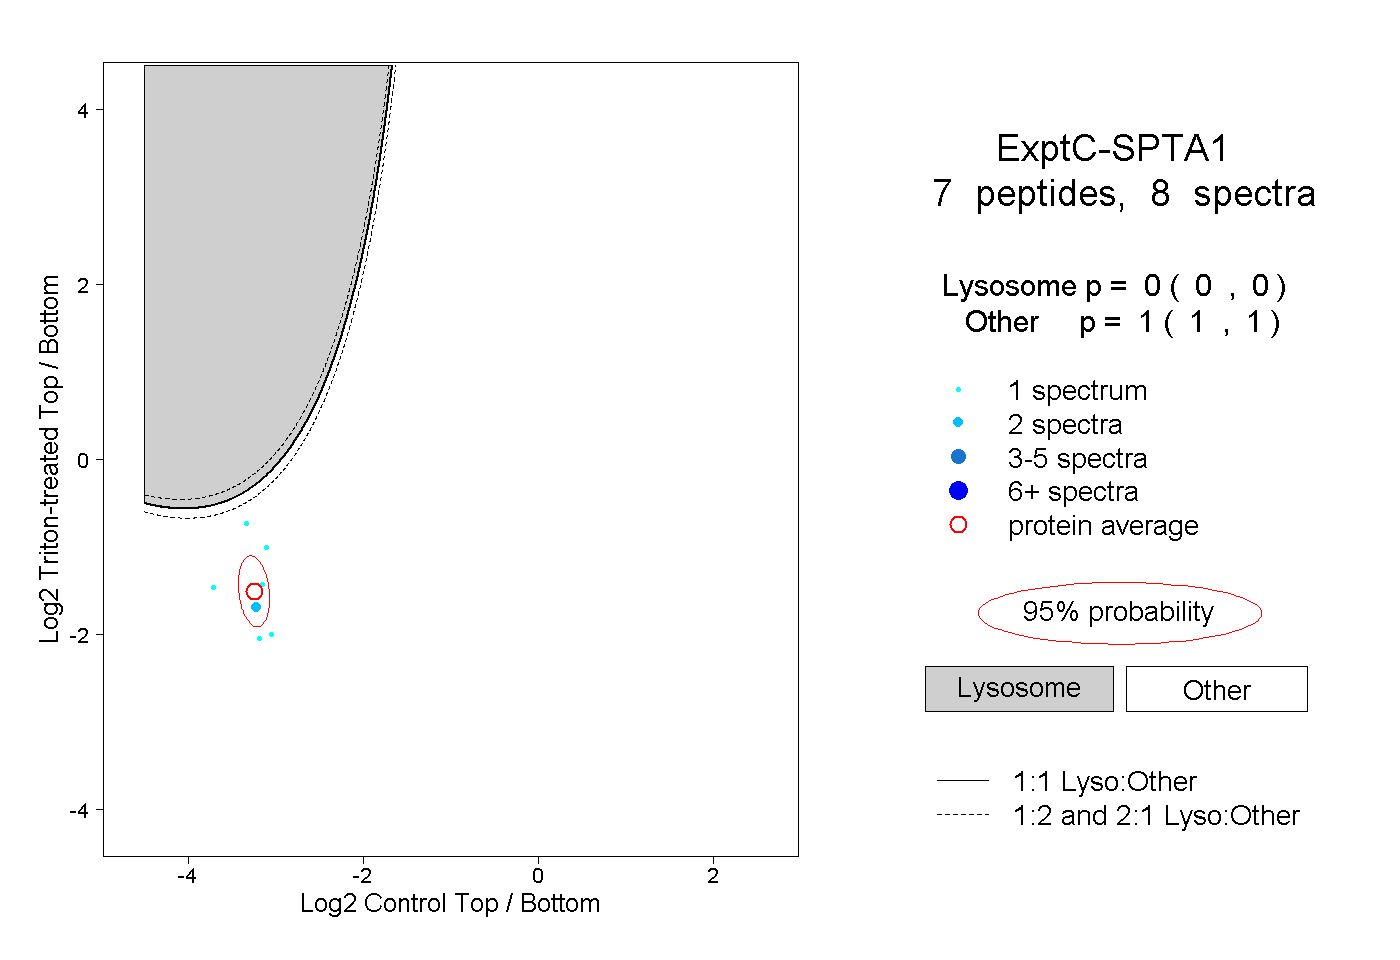
0.000 | 0.000
1.000 | 1.000
3peptides
spectra
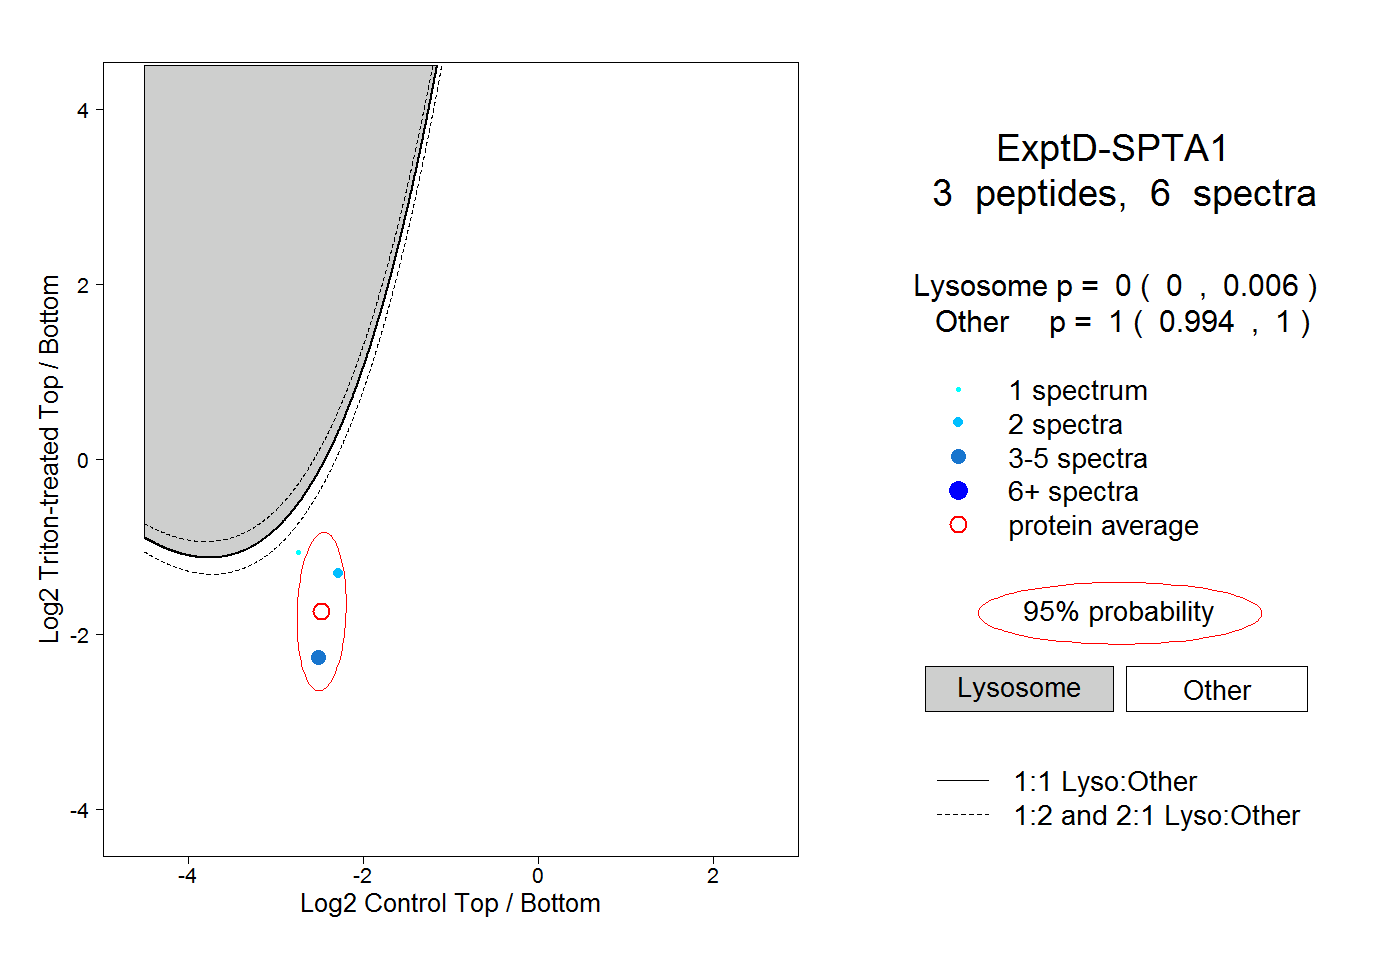
0.000 | 0.006
0.994 | 1.000