 5
5peptides
spectra
0.000 | 0.000
0.095 | 0.133
0.000 | 0.000
0.000 | 0.000
0.000 | 0.000
0.053 | 0.092
0.794 | 0.823
0.000 | 0.000
| Plot | Mito | Lyso | Perox | ER | Golgi | PM | Cytosol | Nucleus | |||||
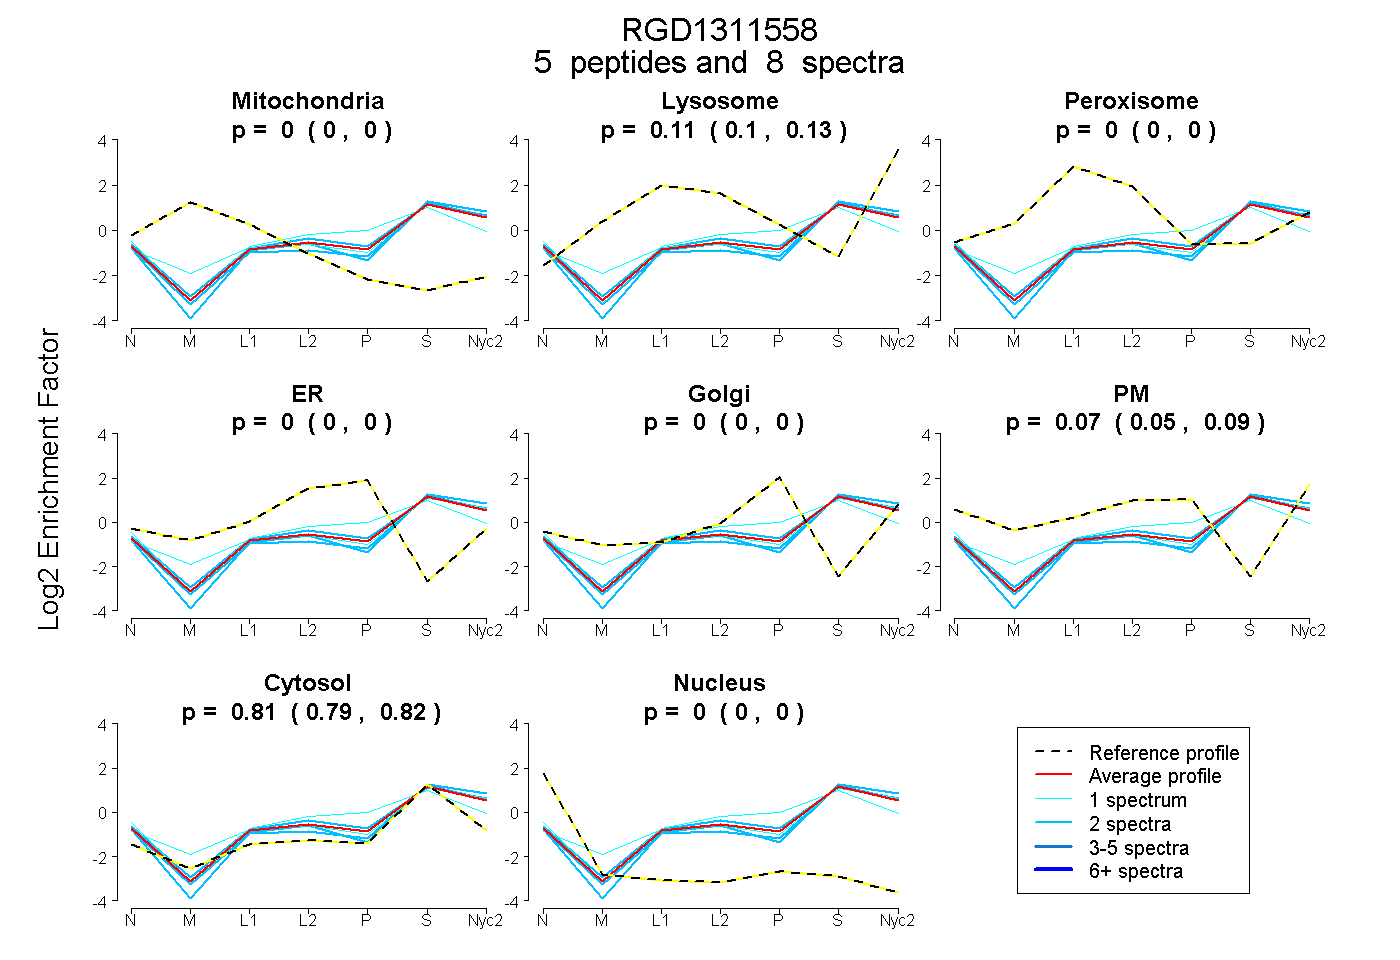
| Expt A |
5 peptides |
8 spectra |
|
0.000 0.000 | 0.000 |
0.115 0.095 | 0.133 |
0.000 0.000 | 0.000 |
0.000 0.000 | 0.000 |
0.000 0.000 | 0.000 |
0.074 0.053 | 0.092 |
0.811 0.794 | 0.823 |
0.000 0.000 | 0.000 |
| 2 spectra, LGEVMEEVNK | 0.000 | 0.111 | 0.000 | 0.000 | 0.000 | 0.025 | 0.863 | 0.000 | ||
| 1 spectrum, IQHQQK | 0.000 | 0.000 | 0.000 | 0.102 | 0.000 | 0.157 | 0.742 | 0.000 | ||
| 2 spectra, AVLNSEVLEQR | 0.000 | 0.129 | 0.000 | 0.000 | 0.000 | 0.098 | 0.773 | 0.000 | ||
| 2 spectra, LIQQLEEER | 0.000 | 0.126 | 0.000 | 0.000 | 0.000 | 0.000 | 0.874 | 0.000 | ||
| 1 spectrum, QAVEEMMDR | 0.000 | 0.220 | 0.000 | 0.000 | 0.000 | 0.020 | 0.760 | 0.000 |
| Plot | Mito | Lyso or Perox | ER | Golgi | PM | Cytosol | Nucleus | ||||||
| Expt B |
1 peptide |
1 spectrum |
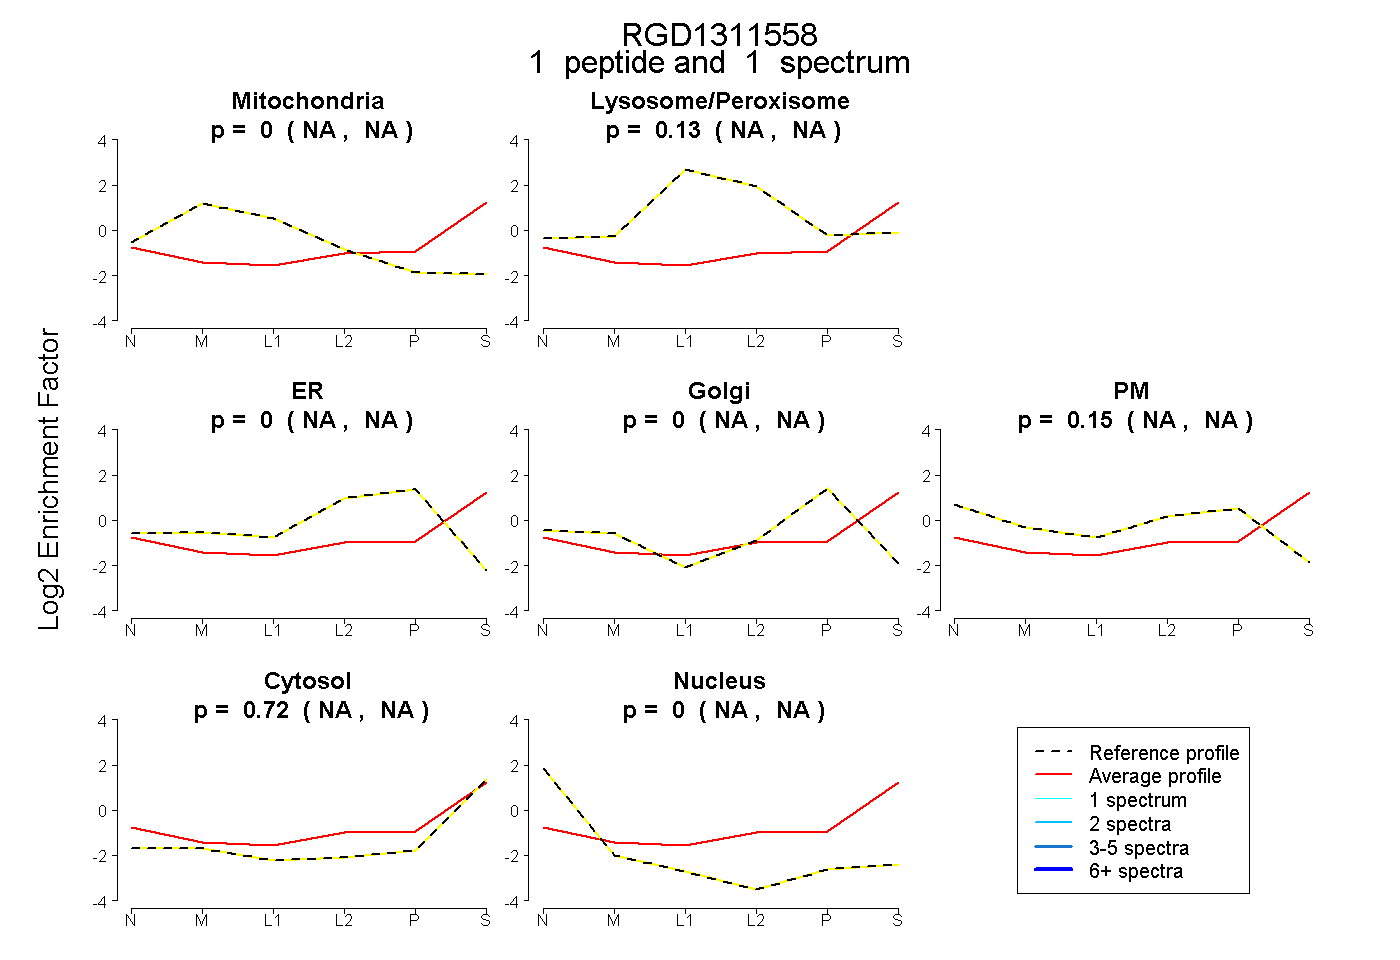 |
0.000 NA | NA |
0.134 NA | NA |
0.000 NA | NA |
0.000 NA | NA |
0.147 NA | NA |
0.719 NA | NA |
0.000 NA | NA |
|||
| Plot | Lyso | Other | |||||||||||
| Expt C |
6 peptides |
14 spectra |
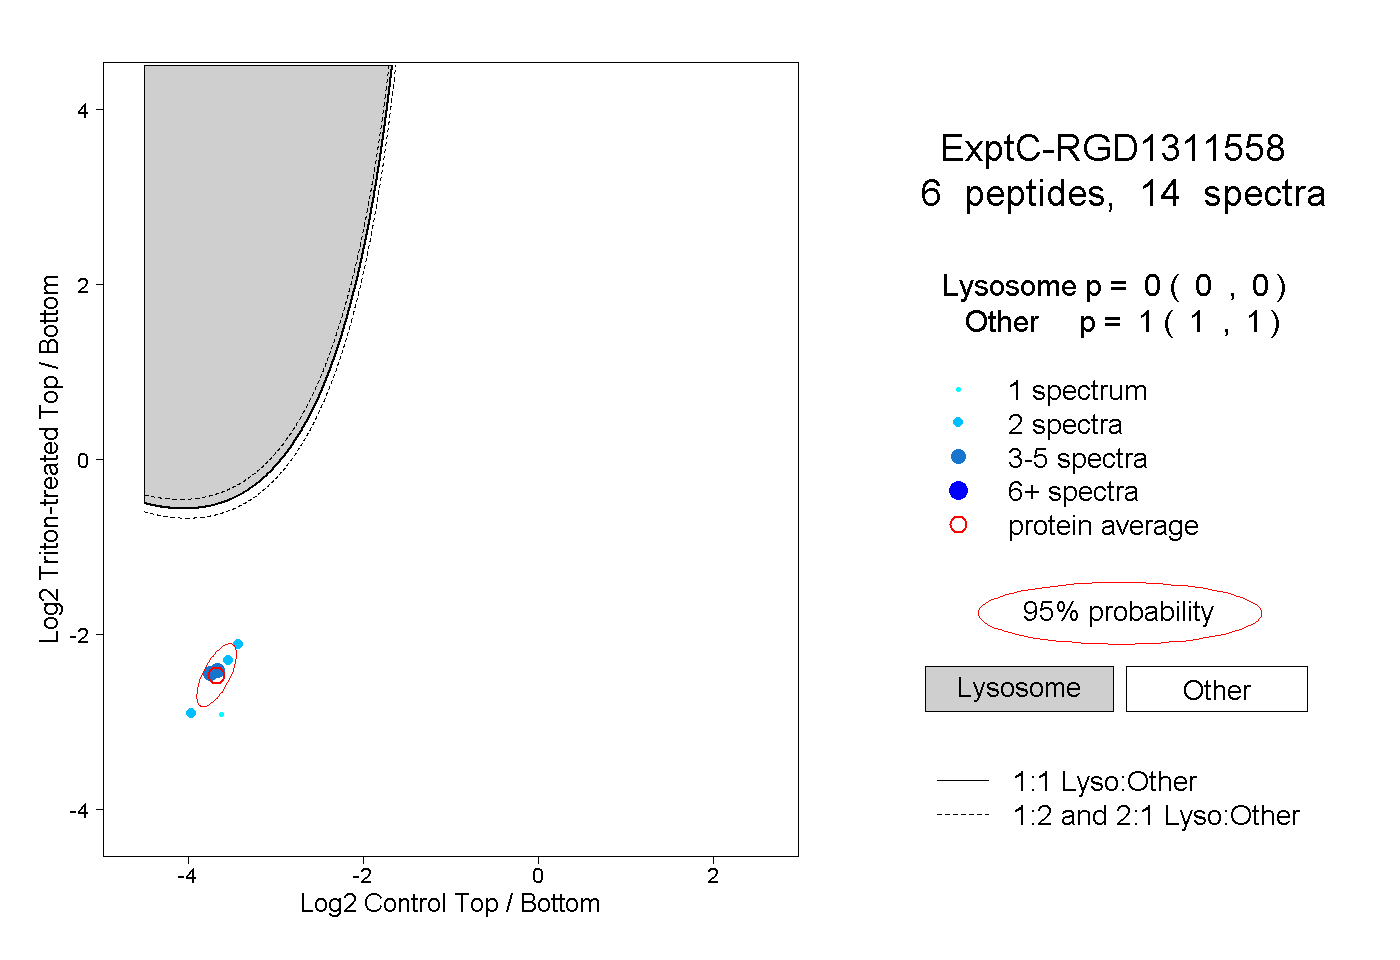 |
0.000 0.000 | 0.000 |
1.000 1.000 | 1.000 |