 4
4peptides
spectra
0.000 | 0.000
0.000 | 0.000
0.000 | 0.066
0.076 | 0.229
0.000 | 0.000
0.008 | 0.181
0.674 | 0.741
0.000 | 0.006
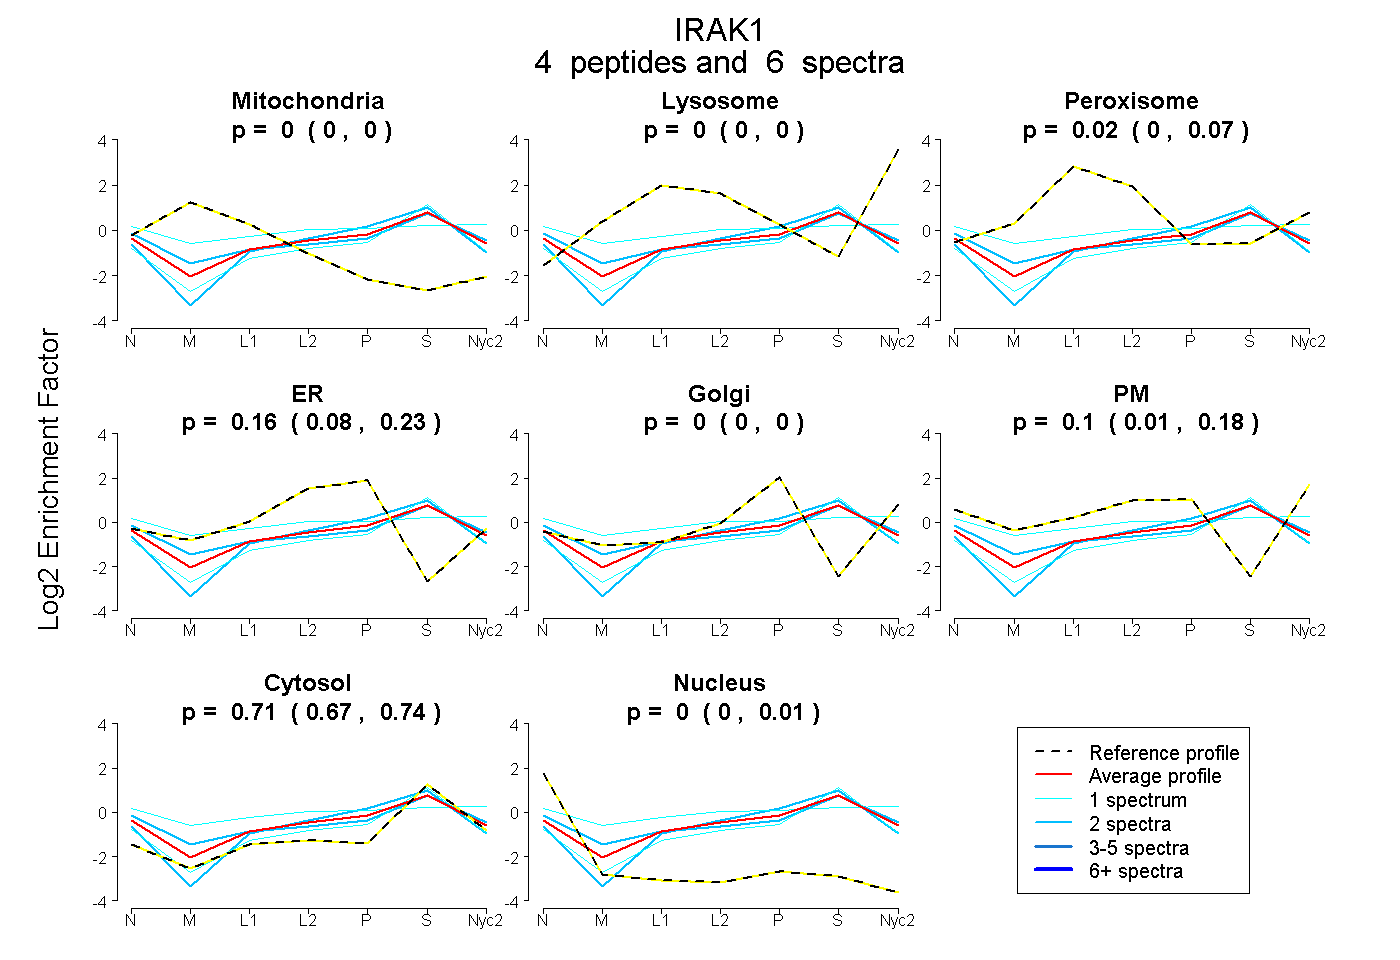
| Plot | Mito | Lyso | Perox | ER | Golgi | PM | Cytosol | Nucleus | |||||
| Expt A |
4 peptides |
6 spectra |
|
0.000 0.000 | 0.000 |
0.000 0.000 | 0.000 |
0.024 0.000 | 0.066 |
0.161 0.076 | 0.229 |
0.000 0.000 | 0.000 |
0.104 0.008 | 0.181 |
0.711 0.674 | 0.741 |
0.000 0.000 | 0.006 |
| 2 spectra, APAQAAQQLQR | 0.000 | 0.000 | 0.000 | 0.217 | 0.000 | 0.000 | 0.783 | 0.000 | ||
| 1 spectrum, QSFLTEVEQLSR | 0.000 | 0.000 | 0.000 | 0.127 | 0.000 | 0.000 | 0.873 | 0.000 | ||
| 2 spectra, GTLAYLPEEYIK | 0.000 | 0.000 | 0.065 | 0.000 | 0.000 | 0.243 | 0.671 | 0.021 | ||
| 1 spectrum, FAGANPSQSSTVAR | 0.000 | 0.000 | 0.171 | 0.000 | 0.000 | 0.391 | 0.439 | 0.000 |
| Plot | Lyso | Other | |||||||||||
| Expt C |
2 peptides |
3 spectra |
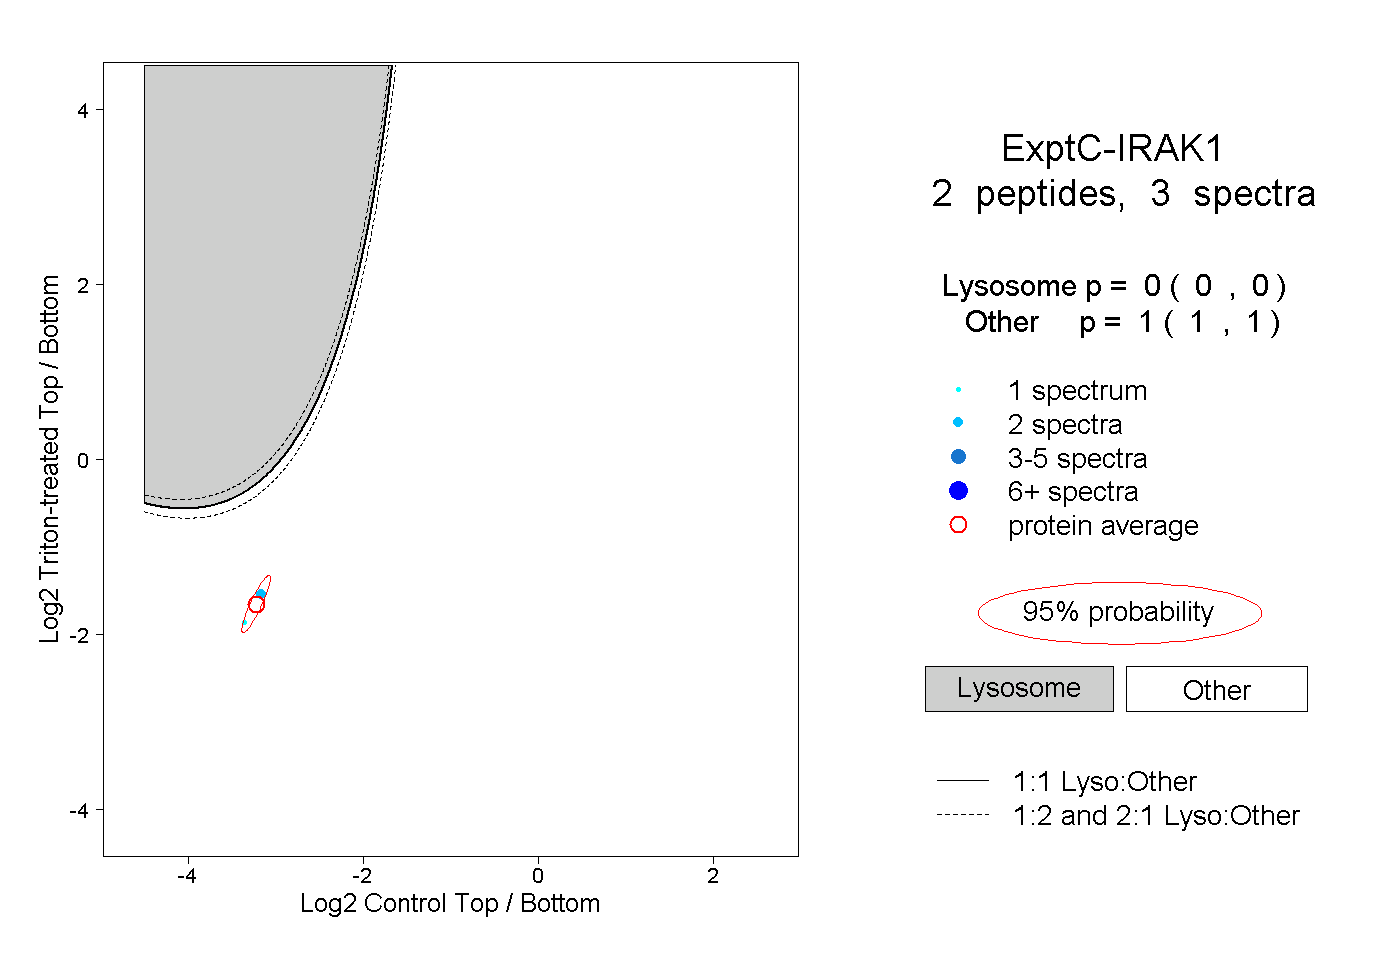 |
0.000 0.000 | 0.000 |
1.000 1.000 | 1.000 |
||||||||
| Plot | Lyso | Other | |||||||||||
| Expt D |
3 peptides |
4 spectra |
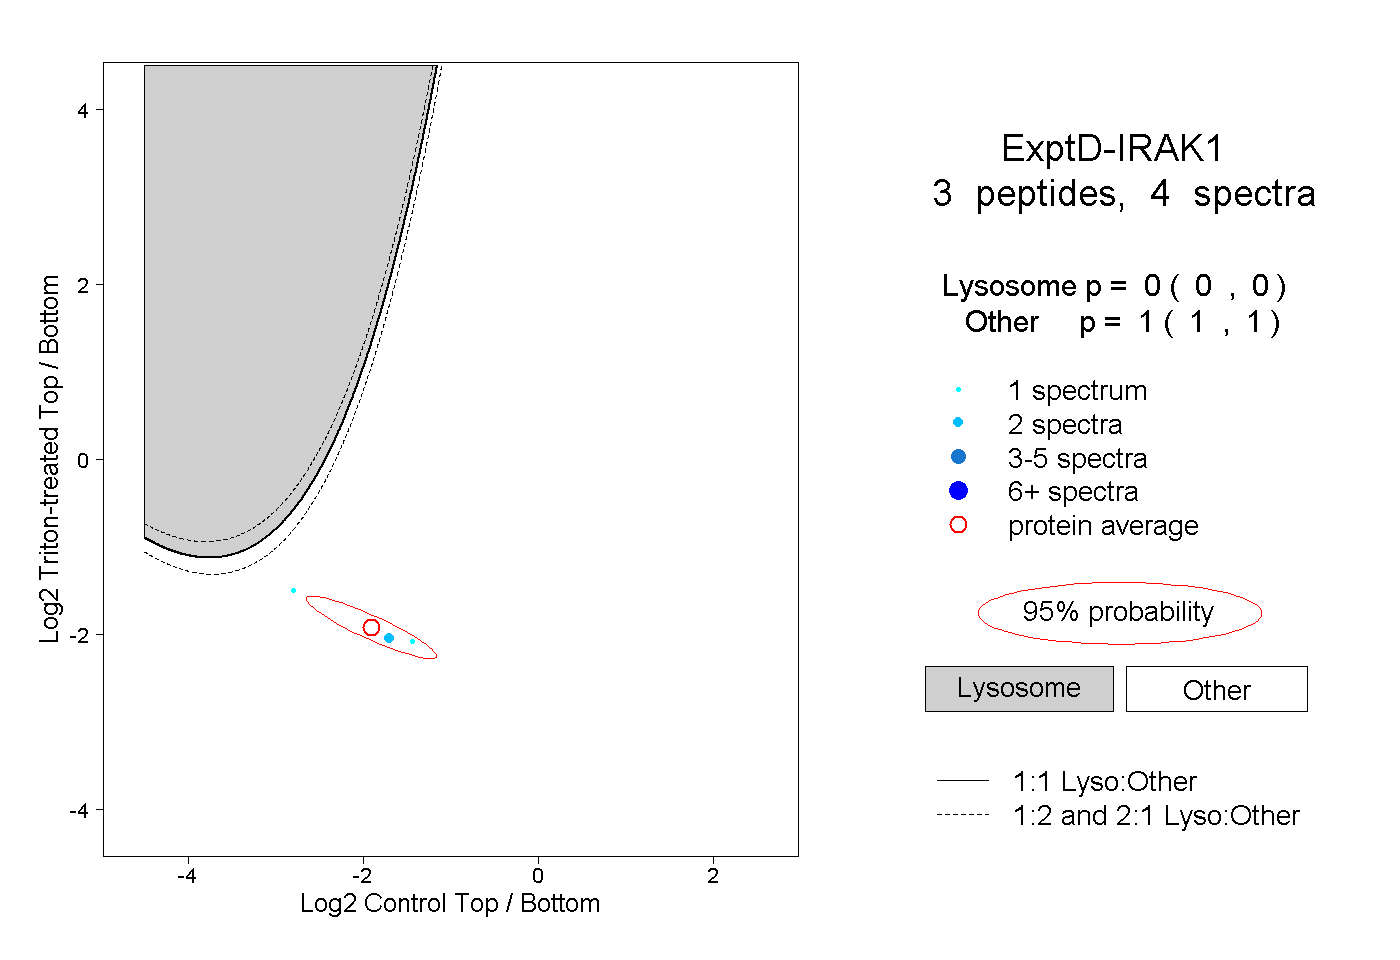 |
0.000 0.000 | 0.000 |
1.000 1.000 | 1.000 |