 1
1peptide
spectrum
NA | NA
NA | NA
NA | NA
NA | NA
NA | NA
NA | NA
NA | NA
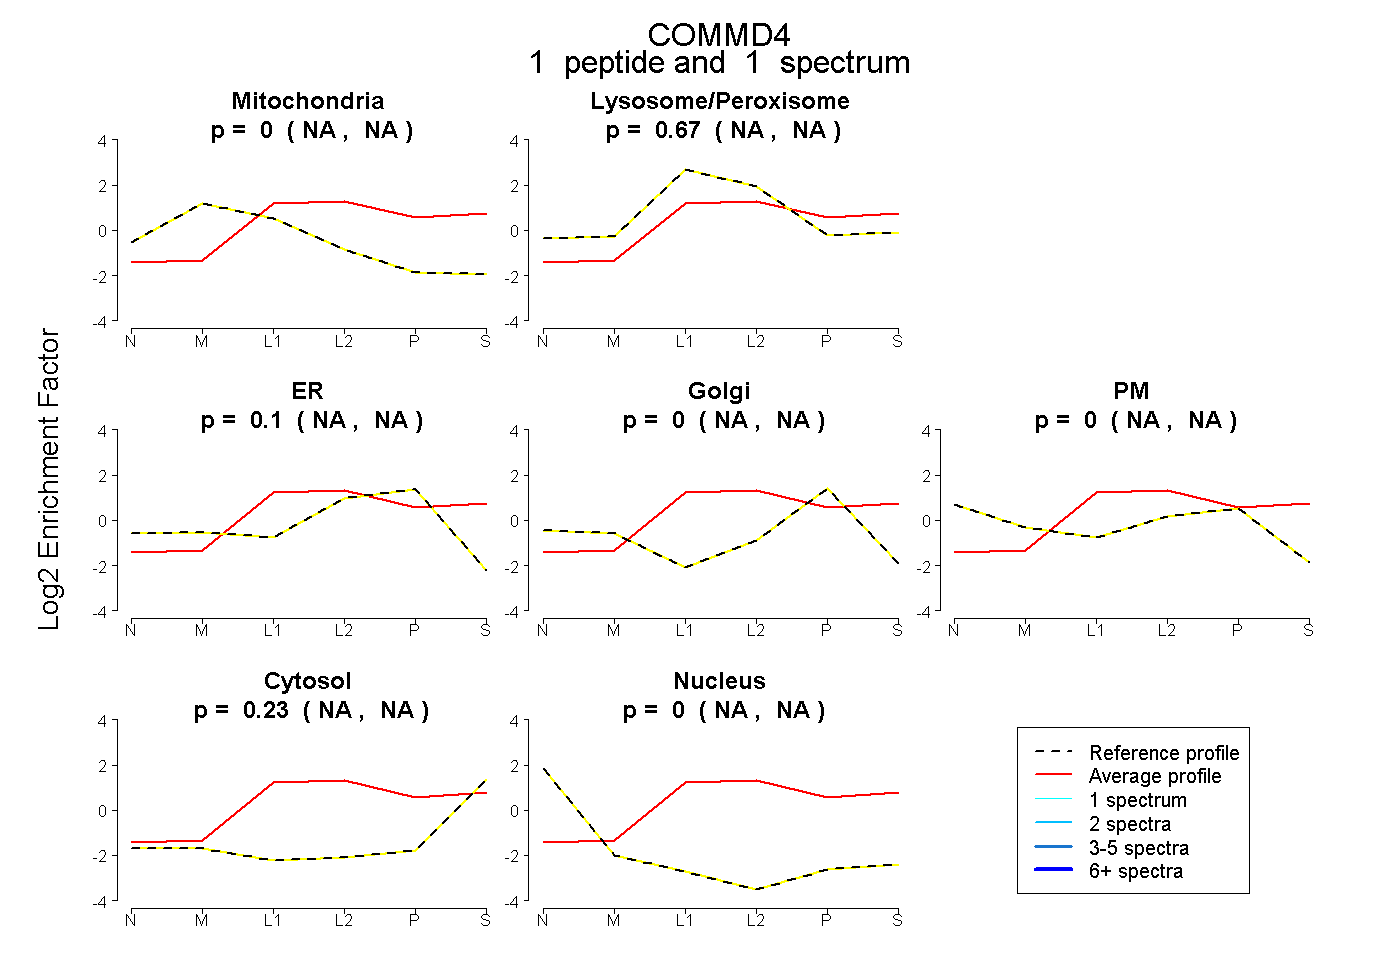
| Plot | Mito | Lyso or Perox | ER | Golgi | PM | Cytosol | Nucleus | ||||||
| Expt B |
1 peptide |
1 spectrum |
|
0.000 NA | NA |
0.668 NA | NA |
0.099 NA | NA |
0.000 NA | NA |
0.000 NA | NA |
0.234 NA | NA |
0.000 NA | NA |
| 1 spectrum, FQVLLAELK | 0.000 | 0.668 | 0.099 | 0.000 | 0.000 | 0.234 | 0.000 |
| Plot | Lyso | Other | |||||||||||
| Expt C |
5 peptides |
9 spectra |
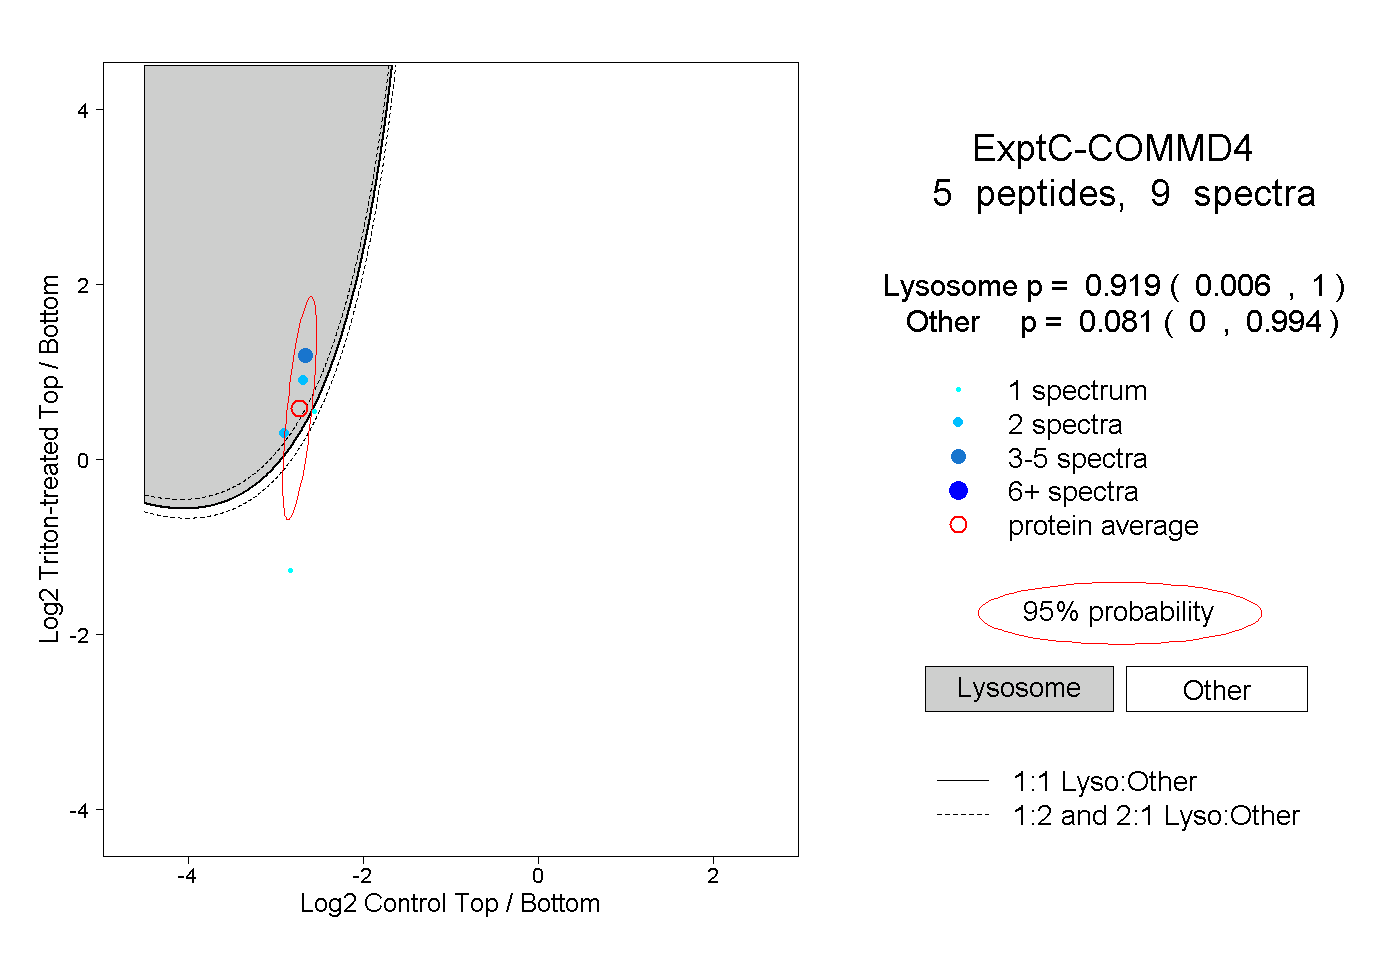 |
0.919 0.006 | 1.000 |
0.081 0.000 | 0.994 |