XPNPEP3
[ENSRNOP00000061709]
Main page
| | | Plot |
Mito |
Lyso |
|
Perox |
ER |
Golgi |
PM |
Cytosol |
Nucleus |
|
| Expt A |
 8
8
peptides |
28
spectra |
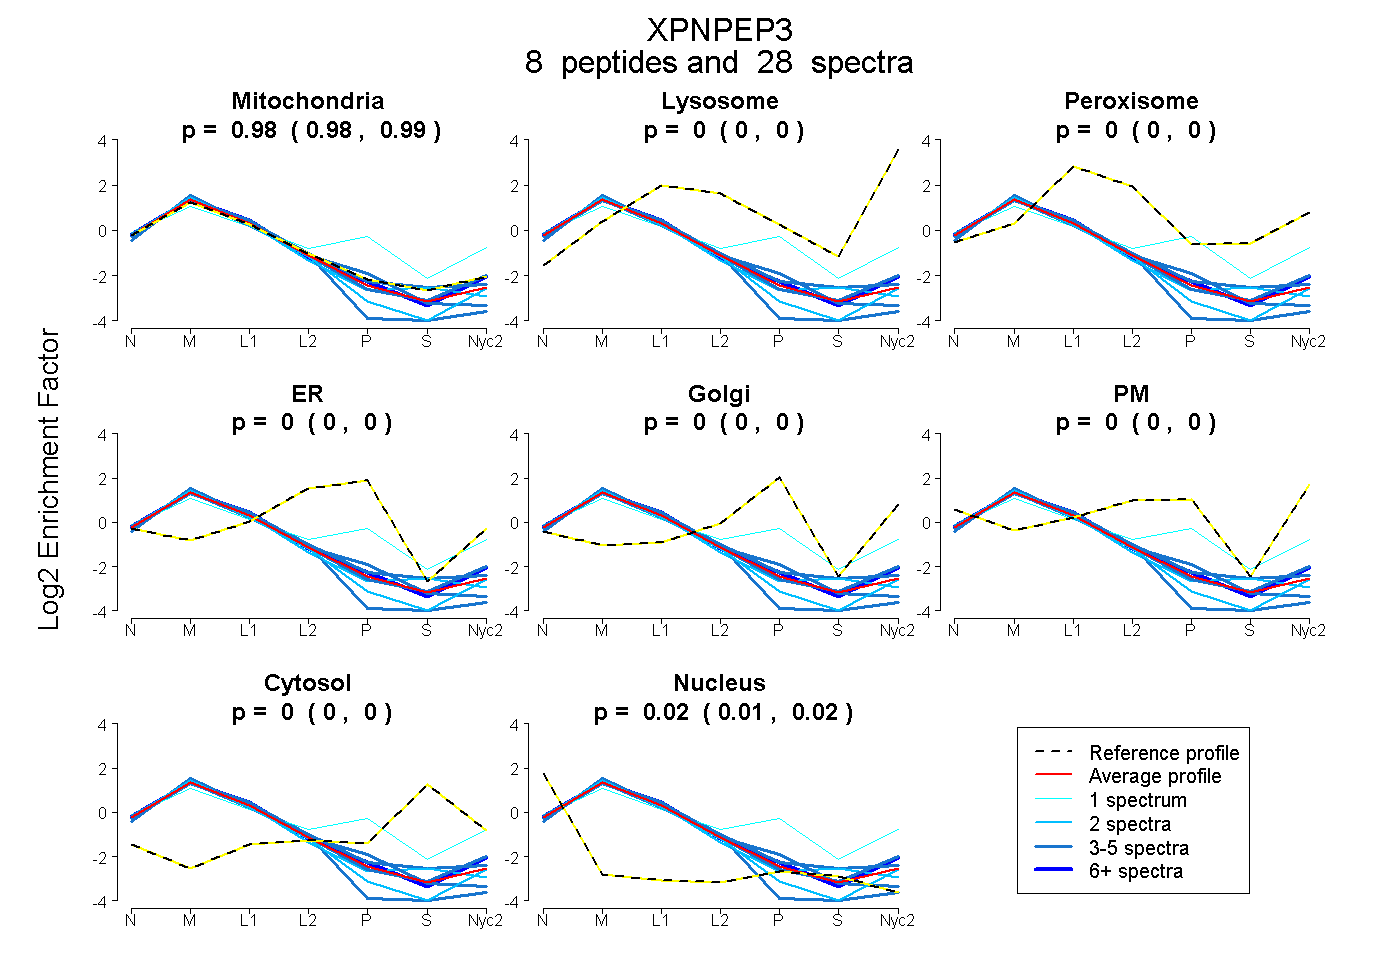 |
0.981
0.976 | 0.985 |
0.000
0.000 | 0.000 |
|
0.000
0.000 | 0.000 |
0.000
0.000 | 0.000 |
0.000
0.000 | 0.000 |
0.000
0.000 | 0.000 |
0.000
0.000 | 0.000 |
0.019
0.014 | 0.023 |
|
| | | Plot |
Mito |
|
Lyso or Perox |
|
ER |
Golgi |
PM |
Cytosol |
Nucleus |
|
| Expt B |
3
peptides |
5
spectra |
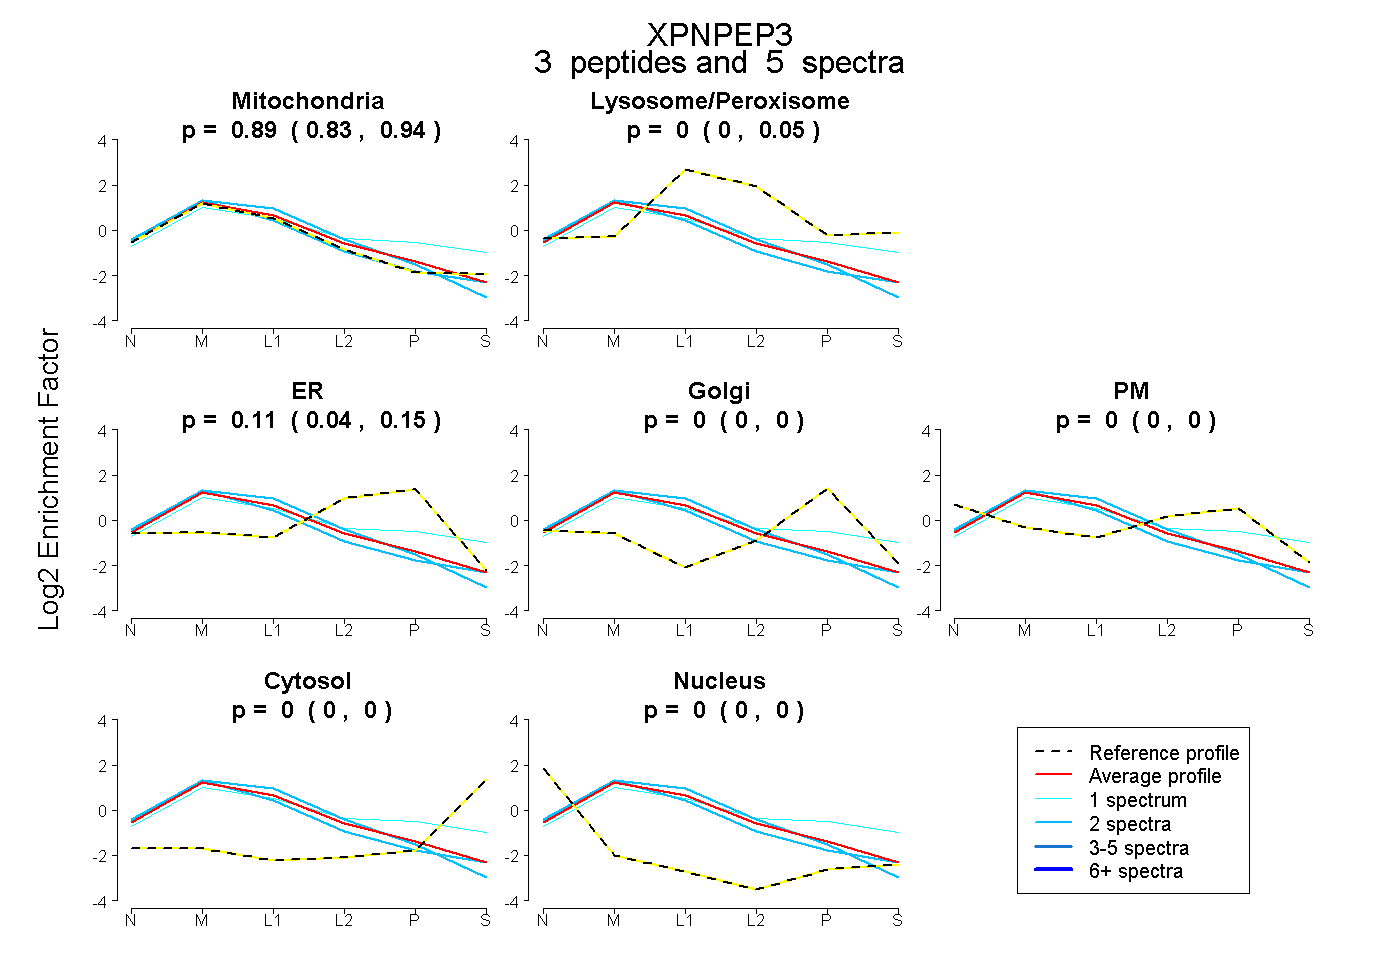 |
0.892
0.830 | 0.939 |
|
0.000
0.000 | 0.053 |
|
0.108
0.038 | 0.149 |
0.000
0.000 | 0.000 |
0.000
0.000 | 0.000 |
0.000
0.000 | 0.000 |
0.000
0.000 | 0.000 |
|
| 1 spectrum, EVNDIEQICSR |
0.539 |
|
0.247 |
|
0.000 |
0.182 |
0.000 |
0.033 |
0.000 |
|
| 2 spectra, SVQHLIQHLR |
0.925 |
|
0.000 |
|
0.075 |
0.000 |
0.000 |
0.000 |
0.000 |
|
| 2 spectra, QLPSHK |
0.974 |
|
0.000 |
|
0.000 |
0.006 |
0.000 |
0.000 |
0.019 |
|
| | | Plot |
|
Lyso |
|
|
|
|
|
|
|
Other |
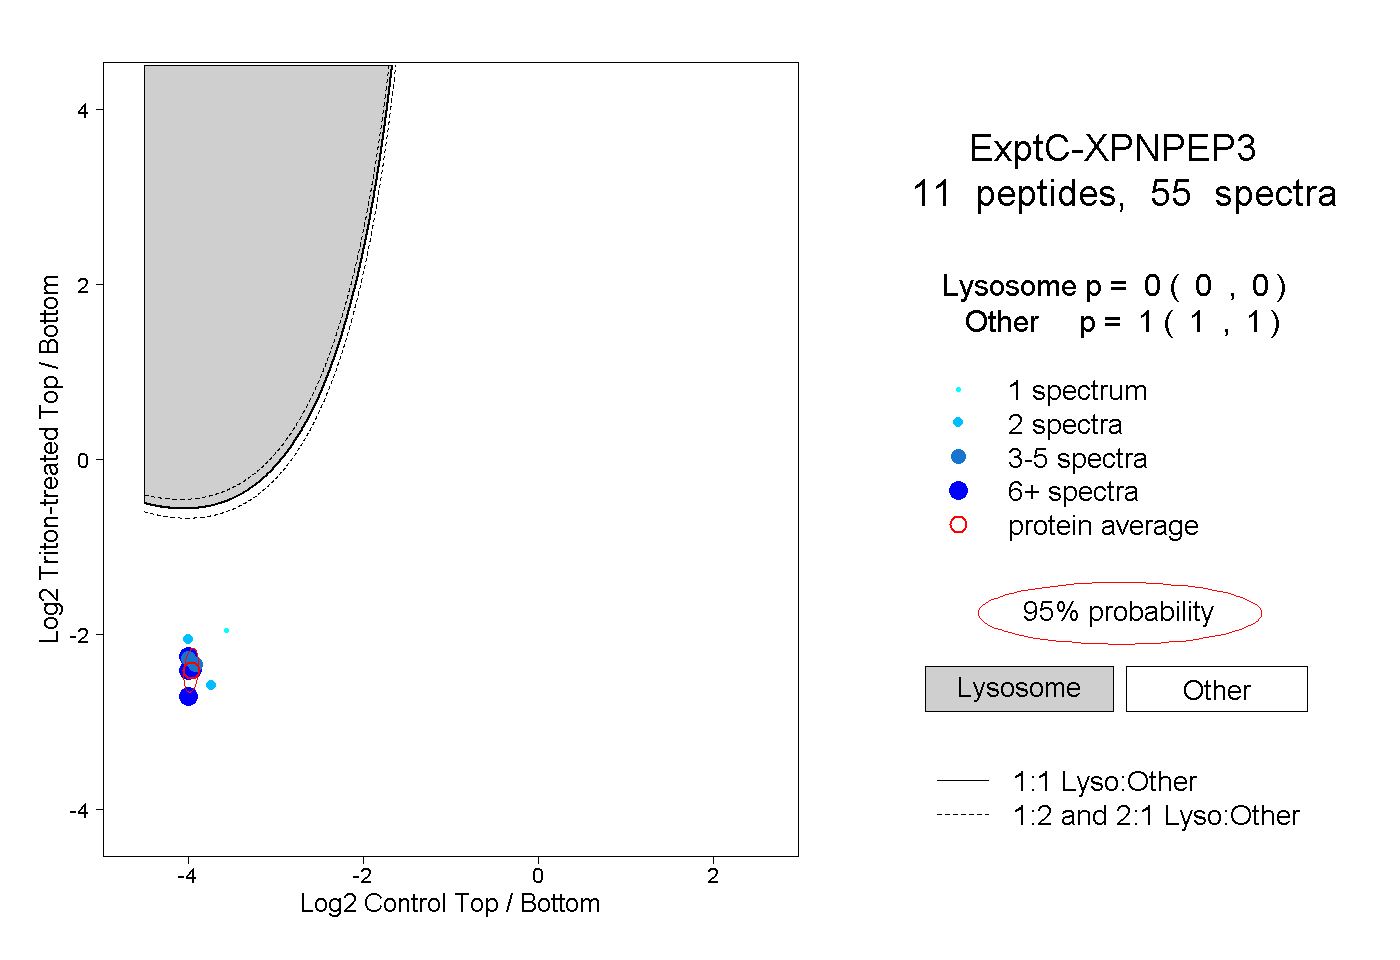
| Expt C |
11
peptides |
55
spectra |
 |
|
0.000
0.000 | 0.000 |
|
|
|
|
|
|
|
1.000
1.000 | 1.000 |
| | | Plot |
|
Lyso |
|
|
|
|
|
|
|
Other |
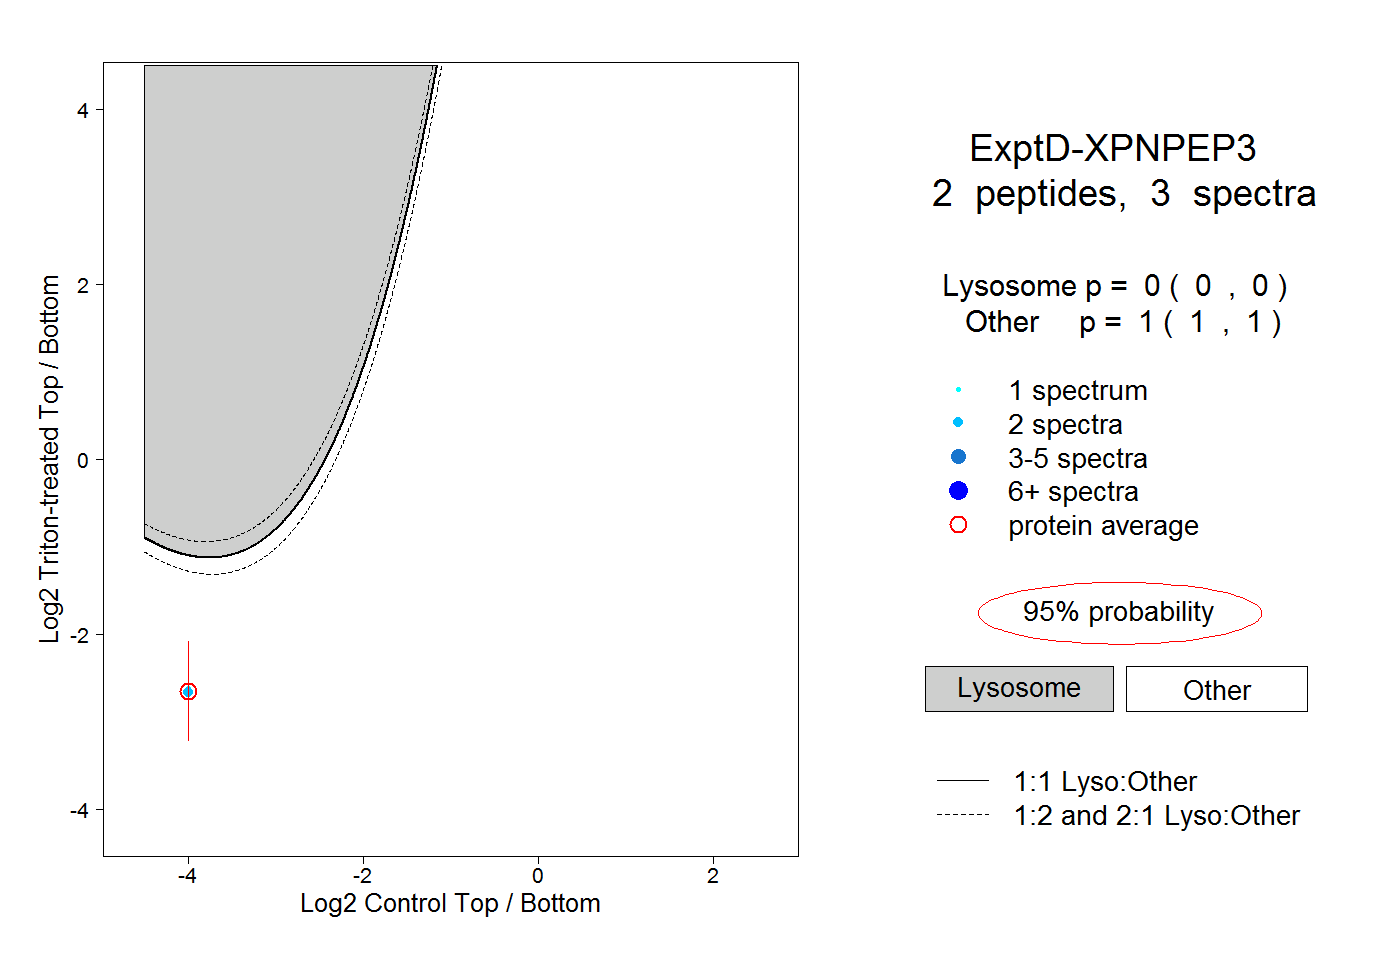
| Expt D |
2
peptides |
3
spectra |
 |
|
0.000
0.000 | 0.000 |
|
|
|
|
|
|
|
1.000
1.000 | 1.000 |