 2
2peptides
spectra
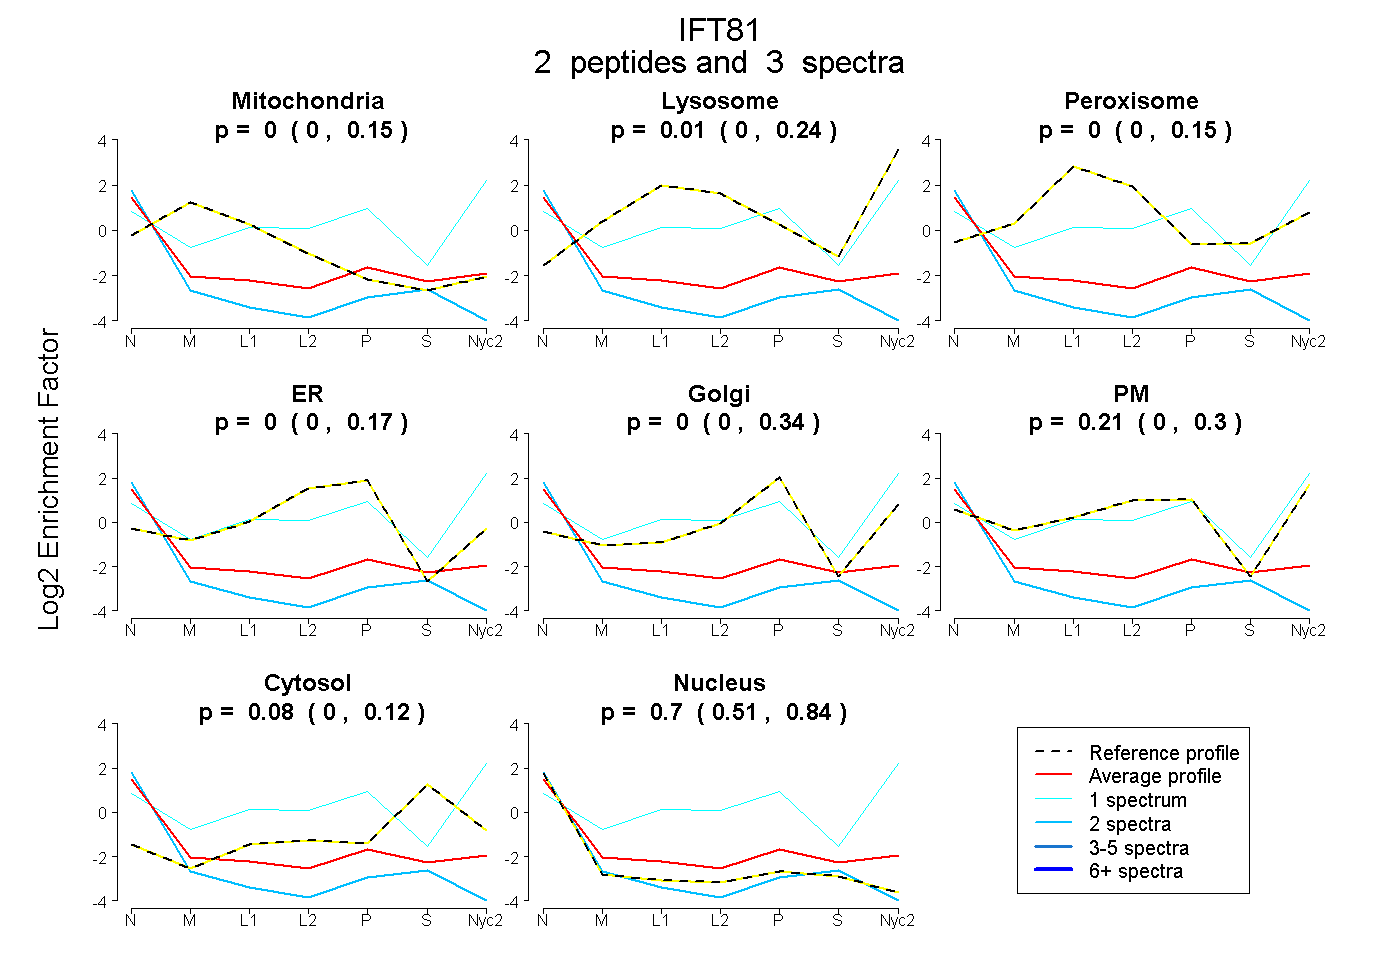
0.000 | 0.153
0.000 | 0.239
0.000 | 0.147
0.000 | 0.166
0.000 | 0.338
0.000 | 0.298
0.000 | 0.116
0.506 | 0.841
1peptide
spectrum
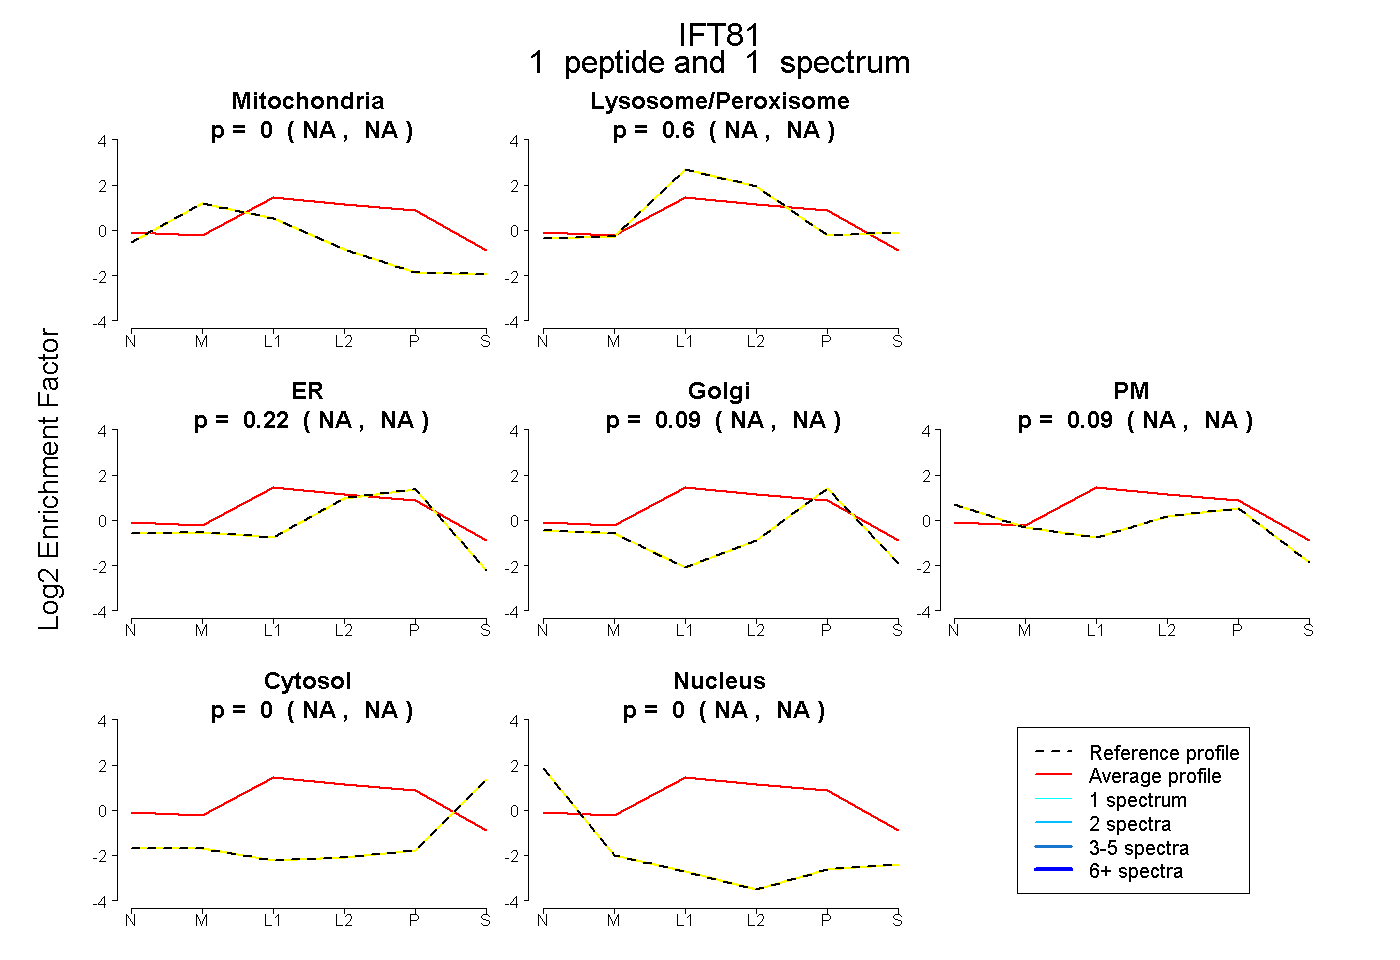
NA | NA
NA | NA
NA | NA
NA | NA
NA | NA
NA | NA
NA | NA
1peptide
spectra
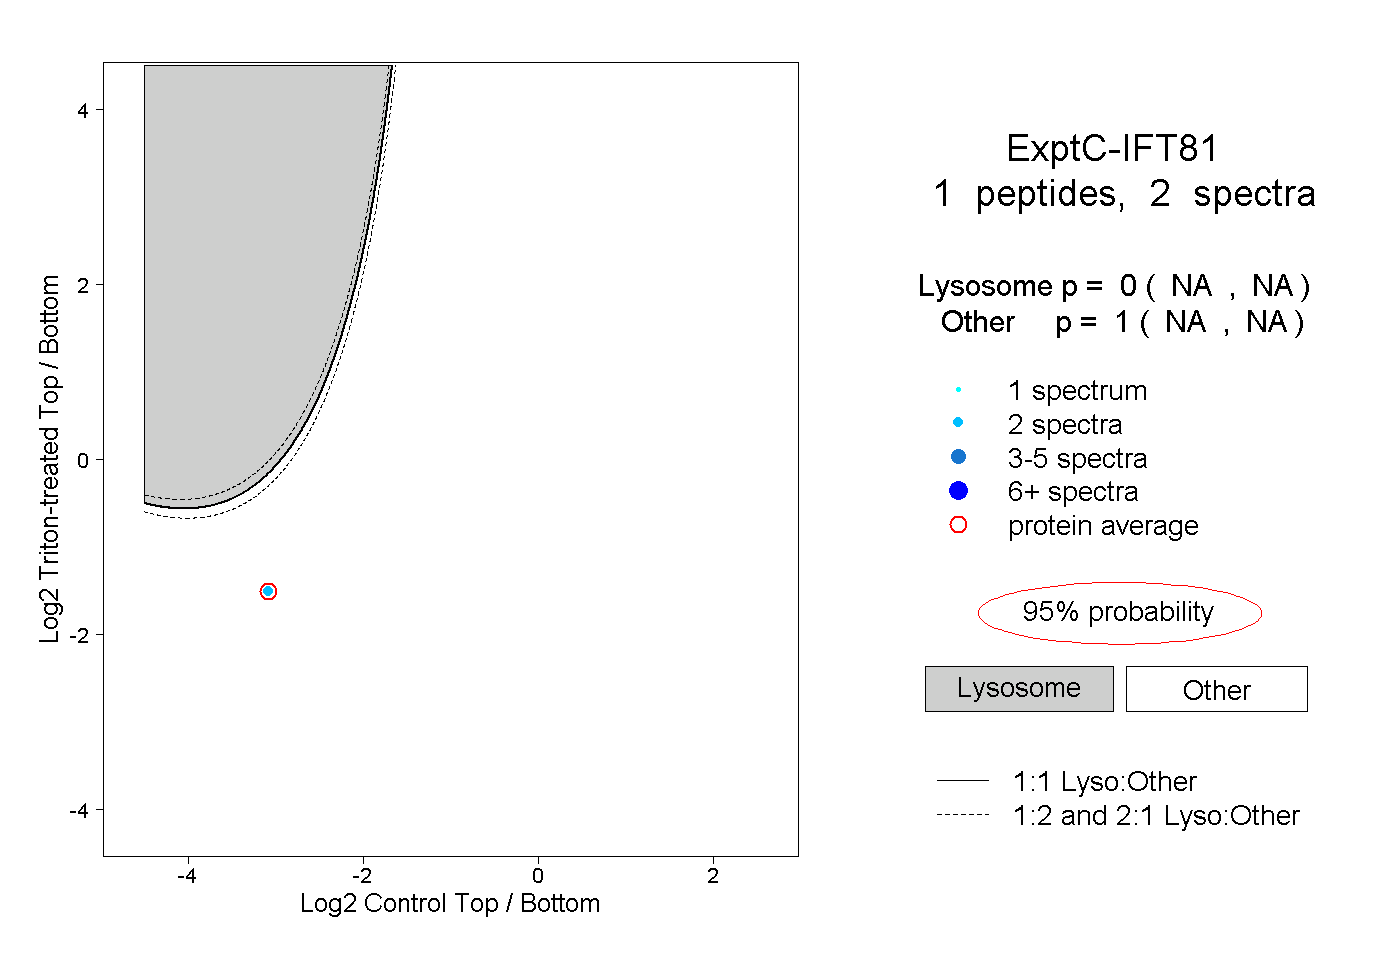
NA | NA
NA | NA