 2
2peptides
spectra
NA | NA
NA | NA
NA | NA
NA | NA
NA | NA
NA | NA
NA | NA
NA | NA
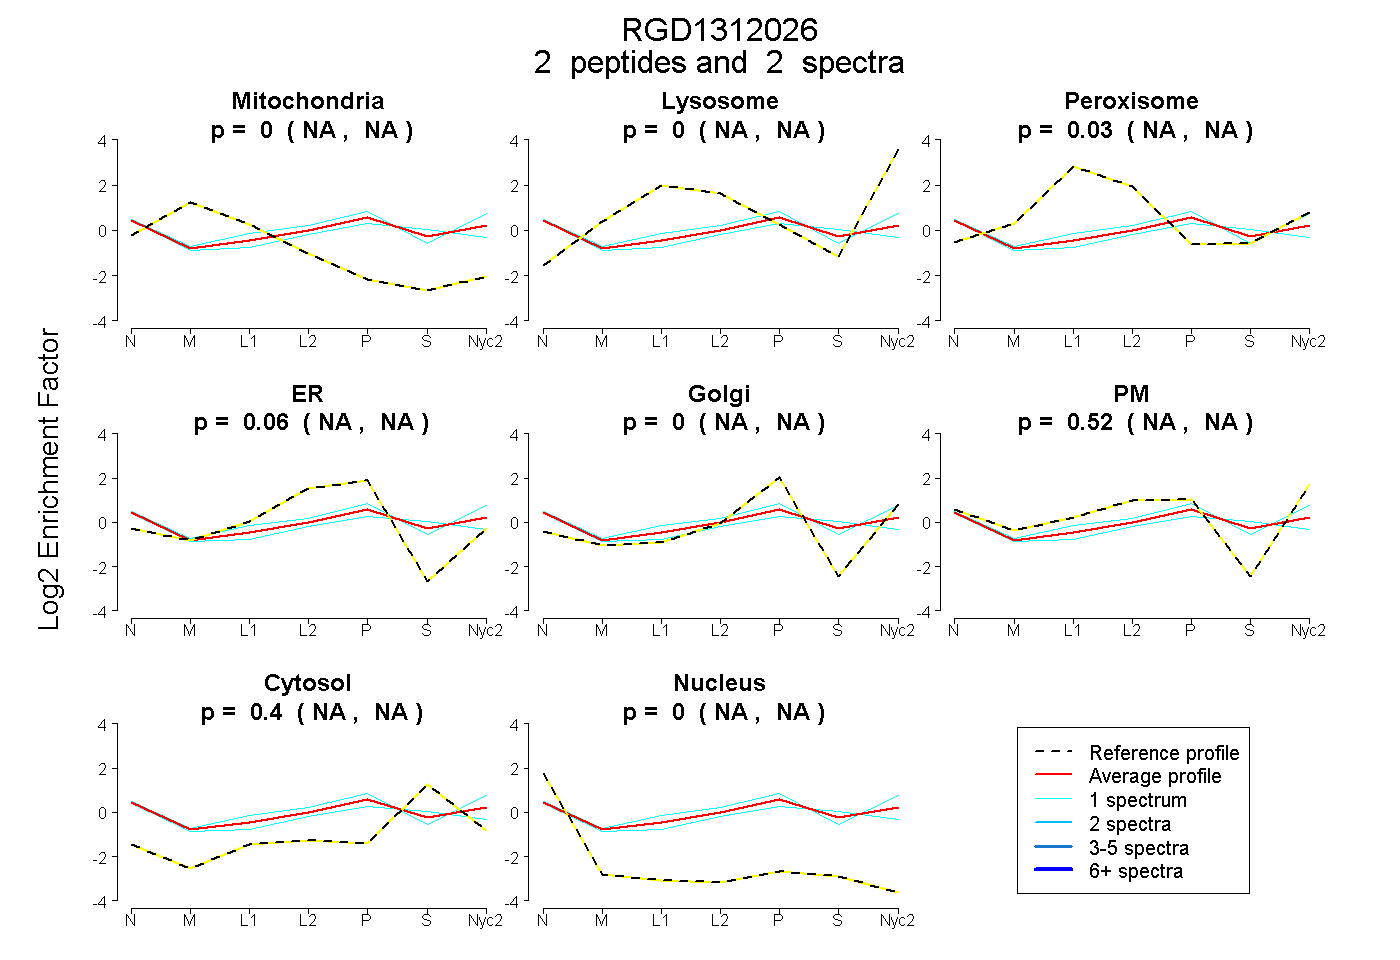
| Plot | Mito | Lyso | Perox | ER | Golgi | PM | Cytosol | Nucleus | |||||
| Expt A |
2 peptides |
2 spectra |
|
0.000 NA | NA |
0.000 NA | NA |
0.026 NA | NA |
0.055 NA | NA |
0.000 NA | NA |
0.518 NA | NA |
0.399 NA | NA |
0.003 NA | NA |
| 1 spectrum, GFSSSAER | 0.000 | 0.000 | 0.056 | 0.000 | 0.036 | 0.616 | 0.292 | 0.000 | ||
| 1 spectrum, SPDLYER | 0.001 | 0.000 | 0.039 | 0.103 | 0.000 | 0.356 | 0.456 | 0.045 |
| Plot | Mito | Lyso or Perox | ER | Golgi | PM | Cytosol | Nucleus | ||||||
| Expt B |
1 peptide |
2 spectra |
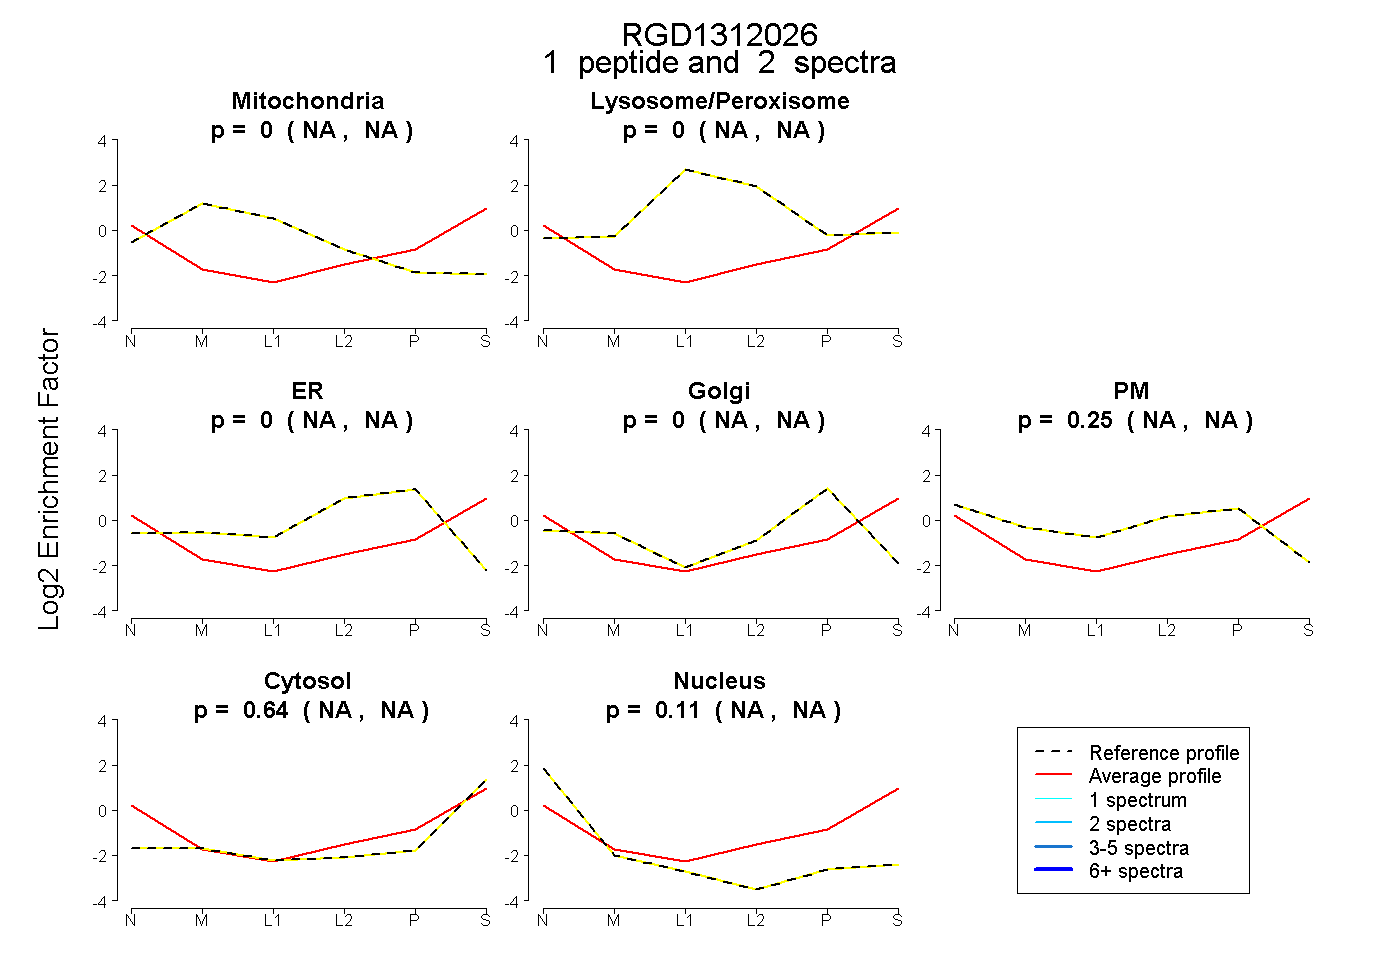 |
0.000 NA | NA |
0.000 NA | NA |
0.000 NA | NA |
0.000 NA | NA |
0.251 NA | NA |
0.643 NA | NA |
0.107 NA | NA |