 5
5peptides
spectra
0.000 | 0.123
0.000 | 0.128
0.000 | 0.179
0.000 | 0.000
0.000 | 0.000
0.192 | 0.353
0.419 | 0.592
0.000 | 0.065
3peptides
spectra
0.000 | 0.000
1.000 | 1.000
| Plot | Mito | Lyso | Perox | ER | Golgi | PM | Cytosol | Nucleus | |||||
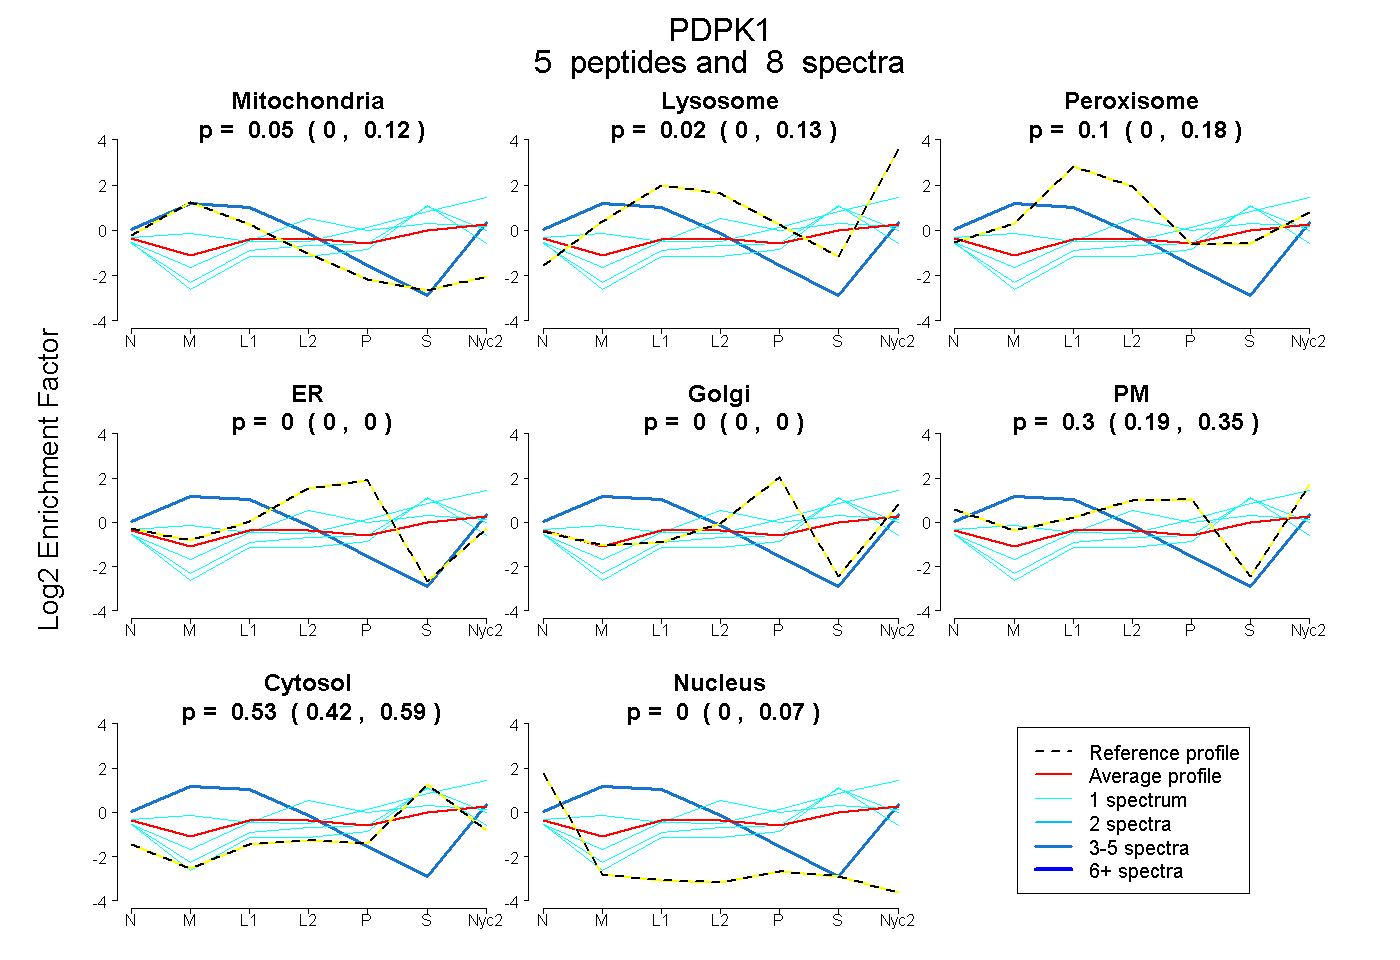
| Expt A |
5 peptides |
8 spectra |
|
0.046 0.000 | 0.123 |
0.024 0.000 | 0.128 |
0.102 0.000 | 0.179 |
0.000 0.000 | 0.000 |
0.000 0.000 | 0.000 |
0.297 0.192 | 0.353 |
0.531 0.419 | 0.592 |
0.000 0.000 | 0.065 |
||
| Plot | Lyso | Other | |||||||||||
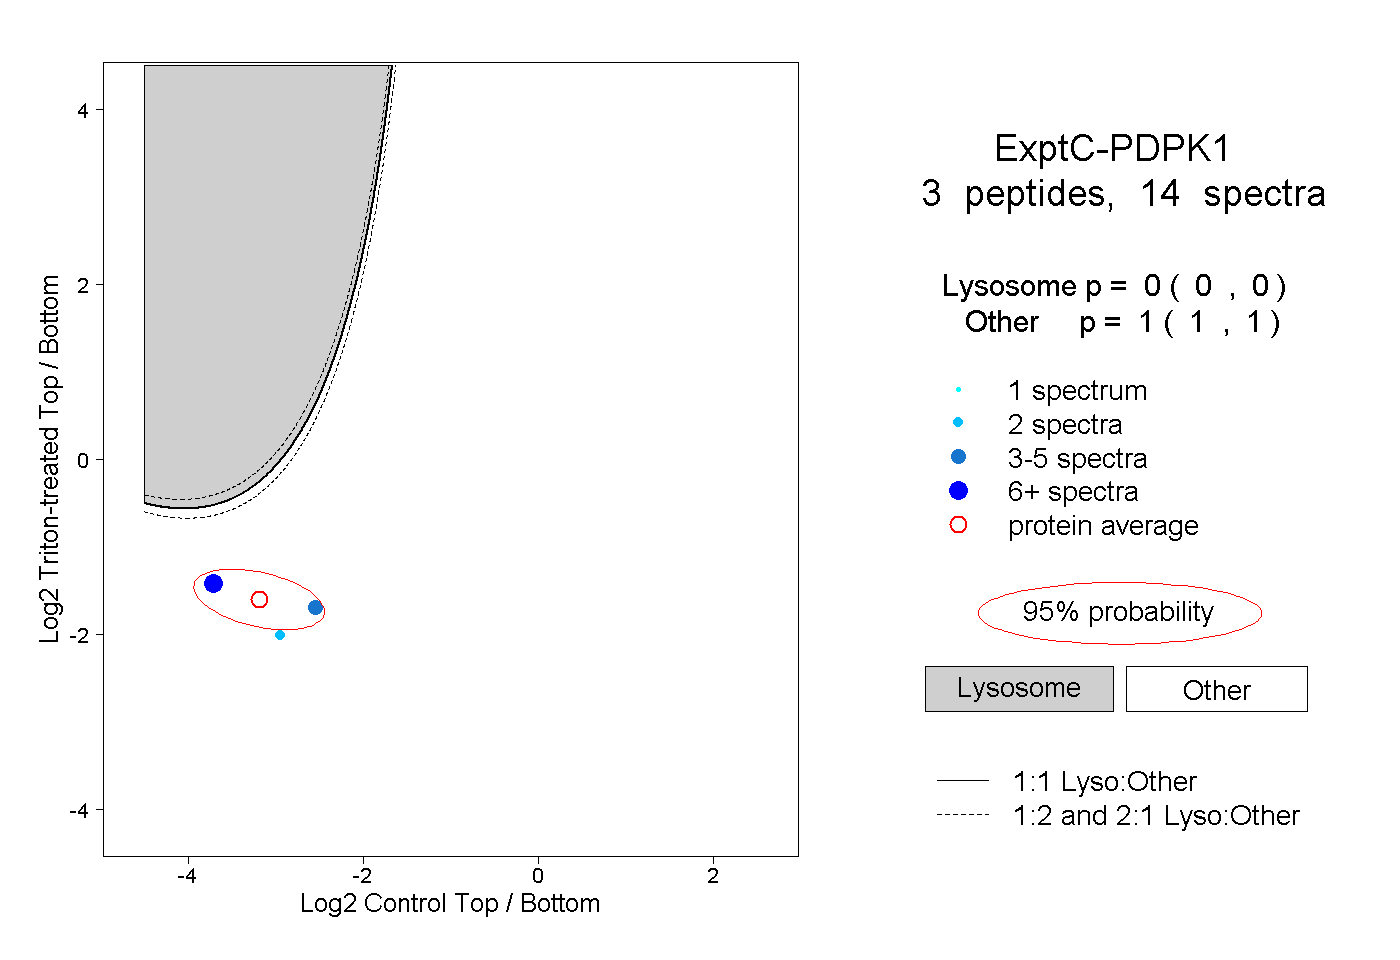
| Expt C |
3 peptides |
14 spectra |
|
0.000 0.000 | 0.000 |
1.000 1.000 | 1.000 |