 21
21peptides
spectra
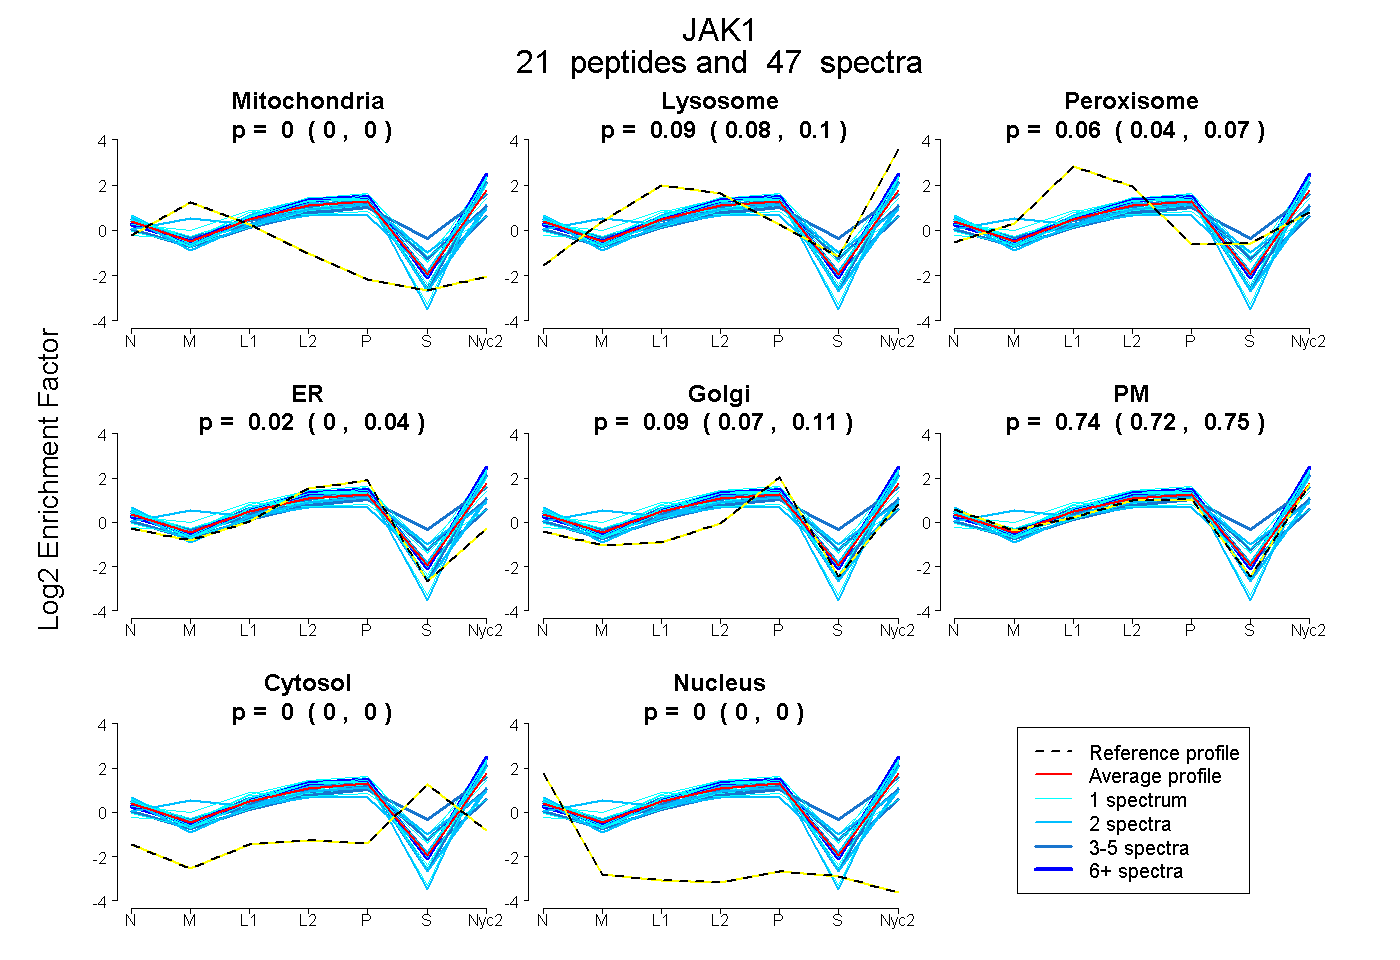
0.000 | 0.000
0.077 | 0.097
0.042 | 0.070
0.005 | 0.036
0.075 | 0.108
0.722 | 0.753
0.000 | 0.000
0.000 | 0.000
1peptide
spectrum
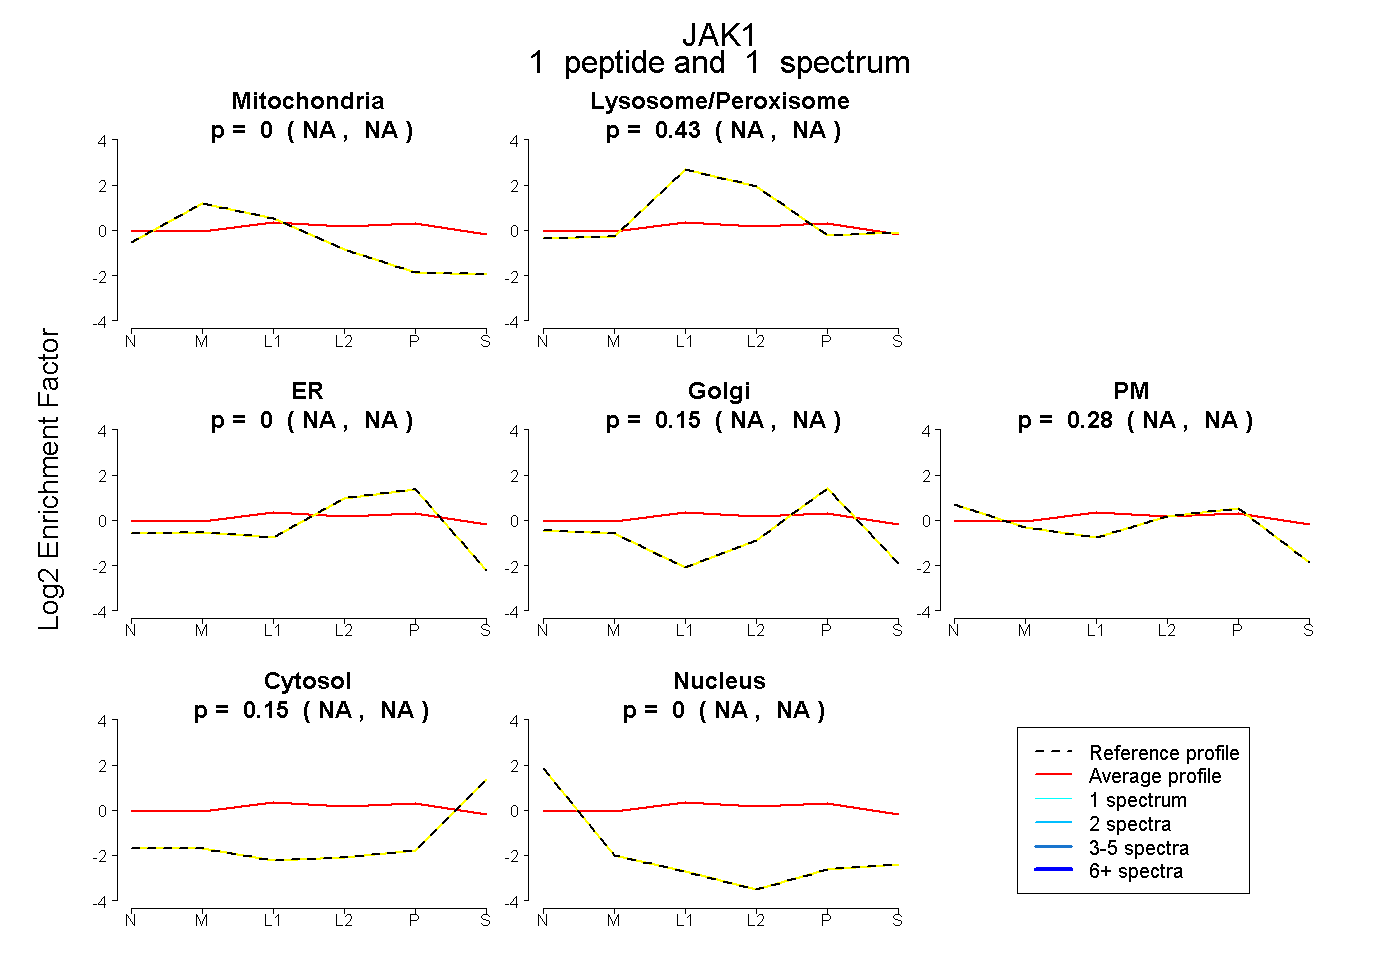
NA | NA
NA | NA
NA | NA
NA | NA
NA | NA
NA | NA
NA | NA
23peptides
spectra
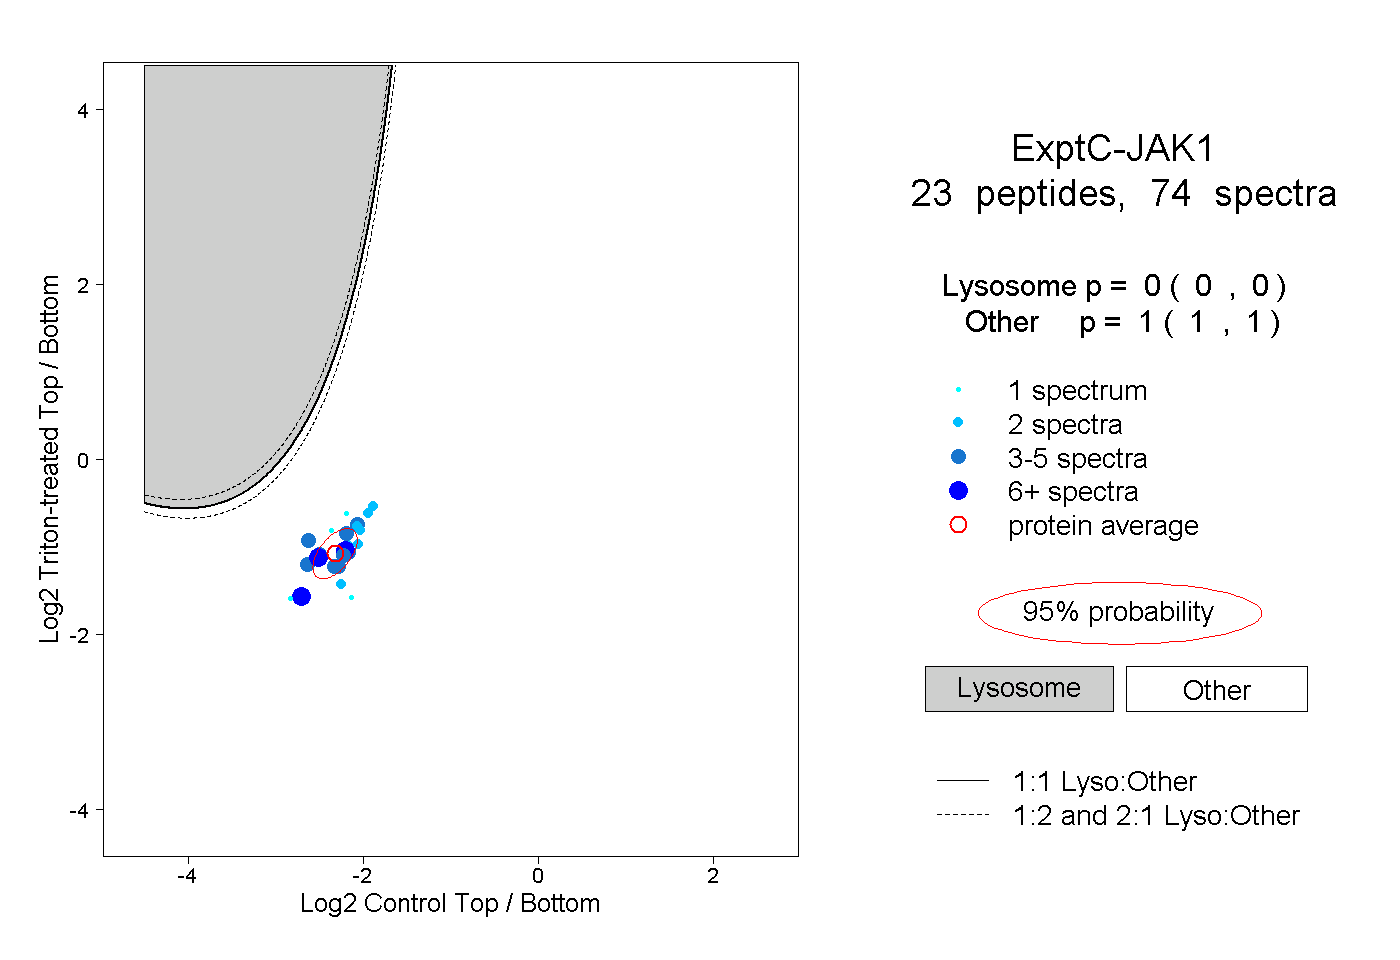
0.000 | 0.000
1.000 | 1.000
2peptides
spectra
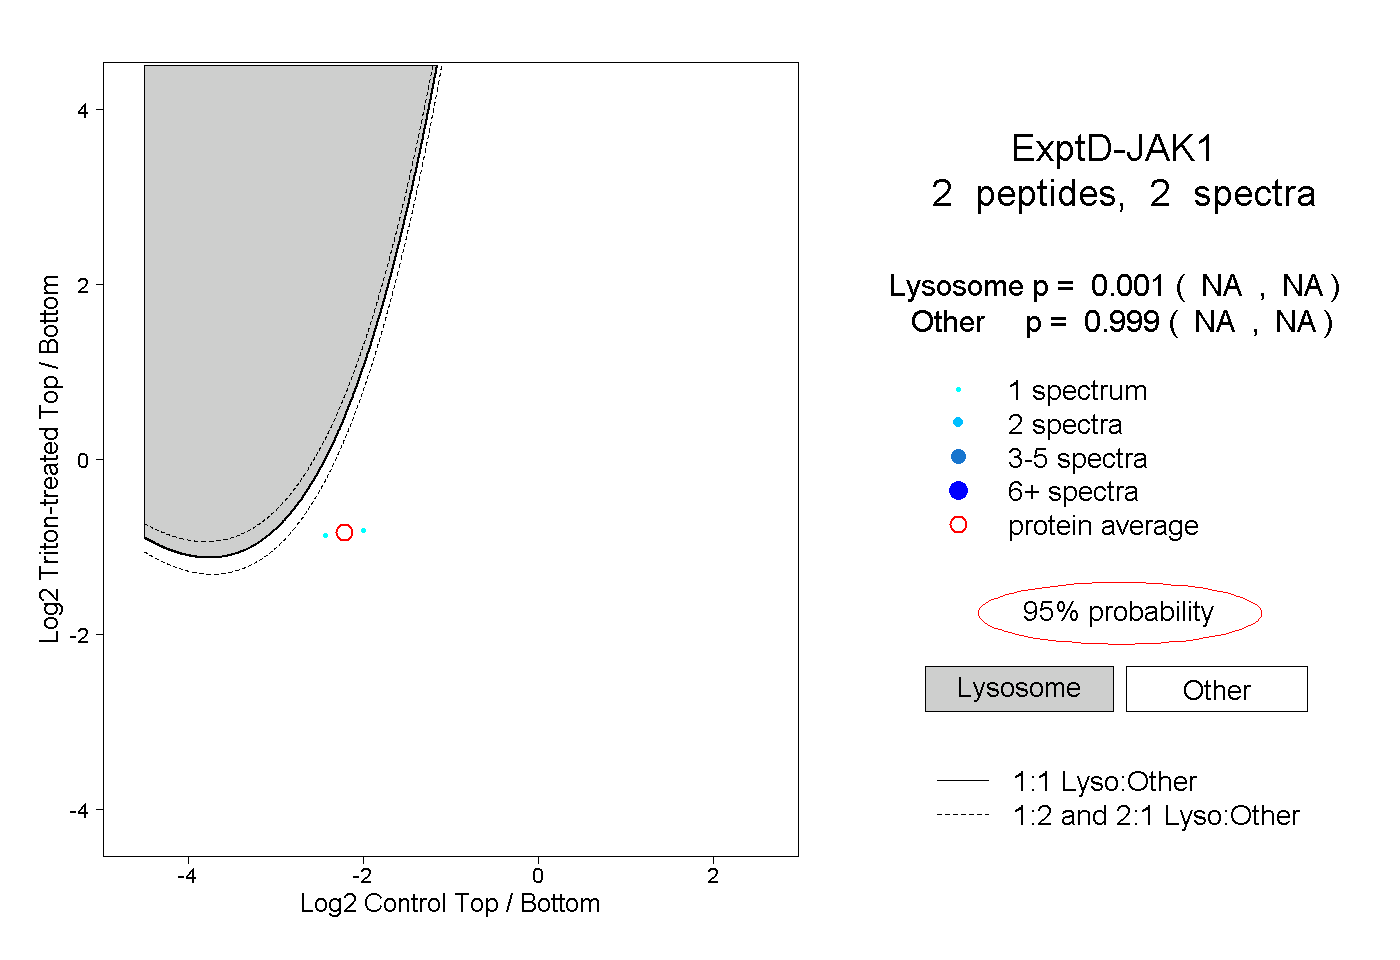
NA | NA
NA | NA