 19
19peptides
spectra
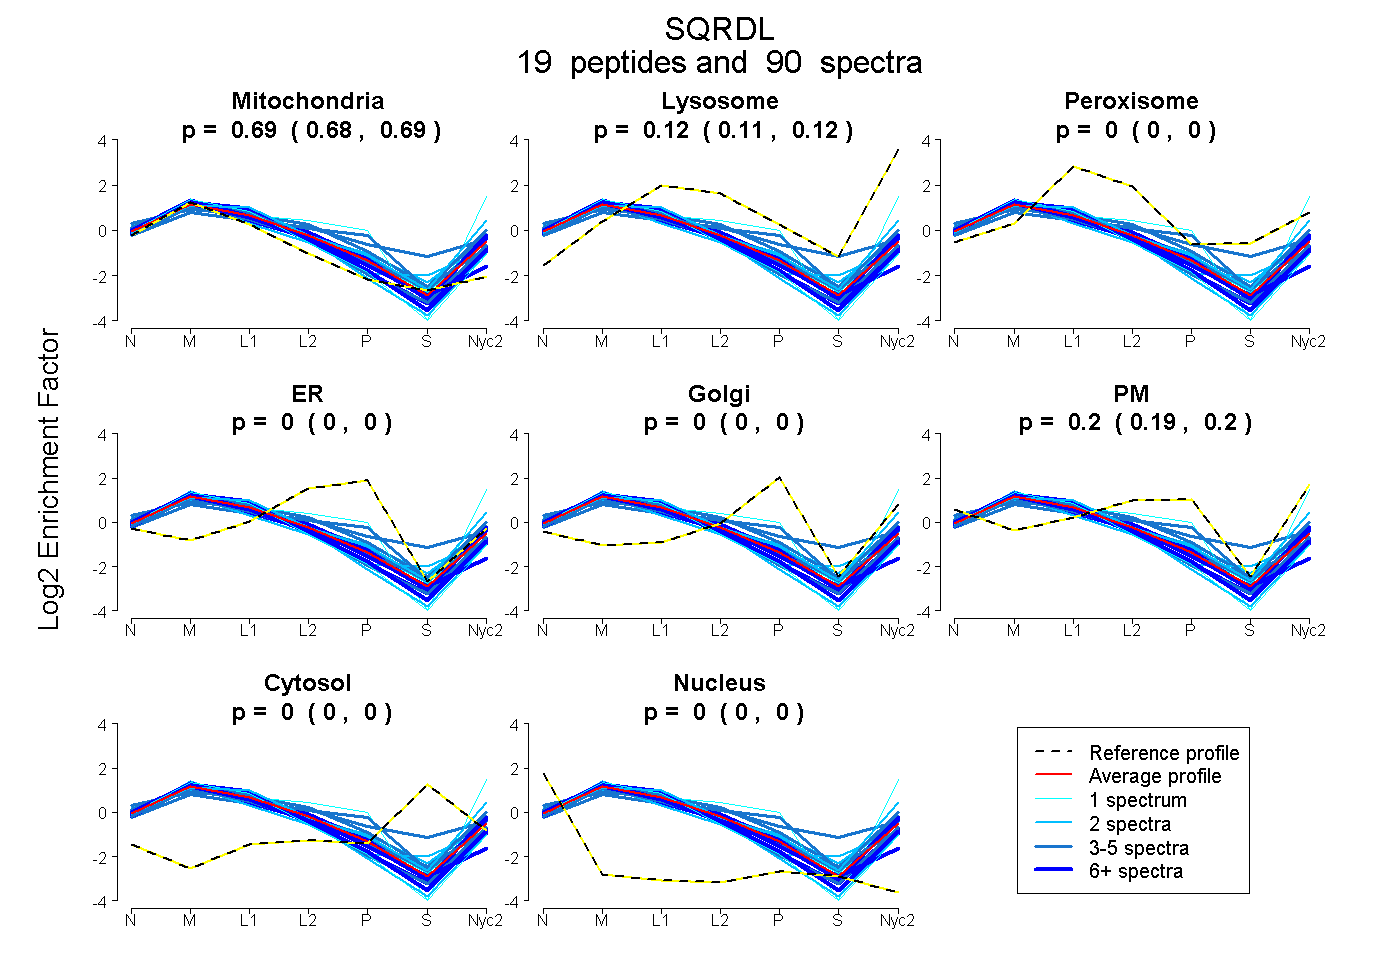
0.682 | 0.690
0.111 | 0.120
0.000 | 0.000
0.000 | 0.000
0.000 | 0.000
0.192 | 0.203
0.000 | 0.000
0.000 | 0.000
15peptides
spectra
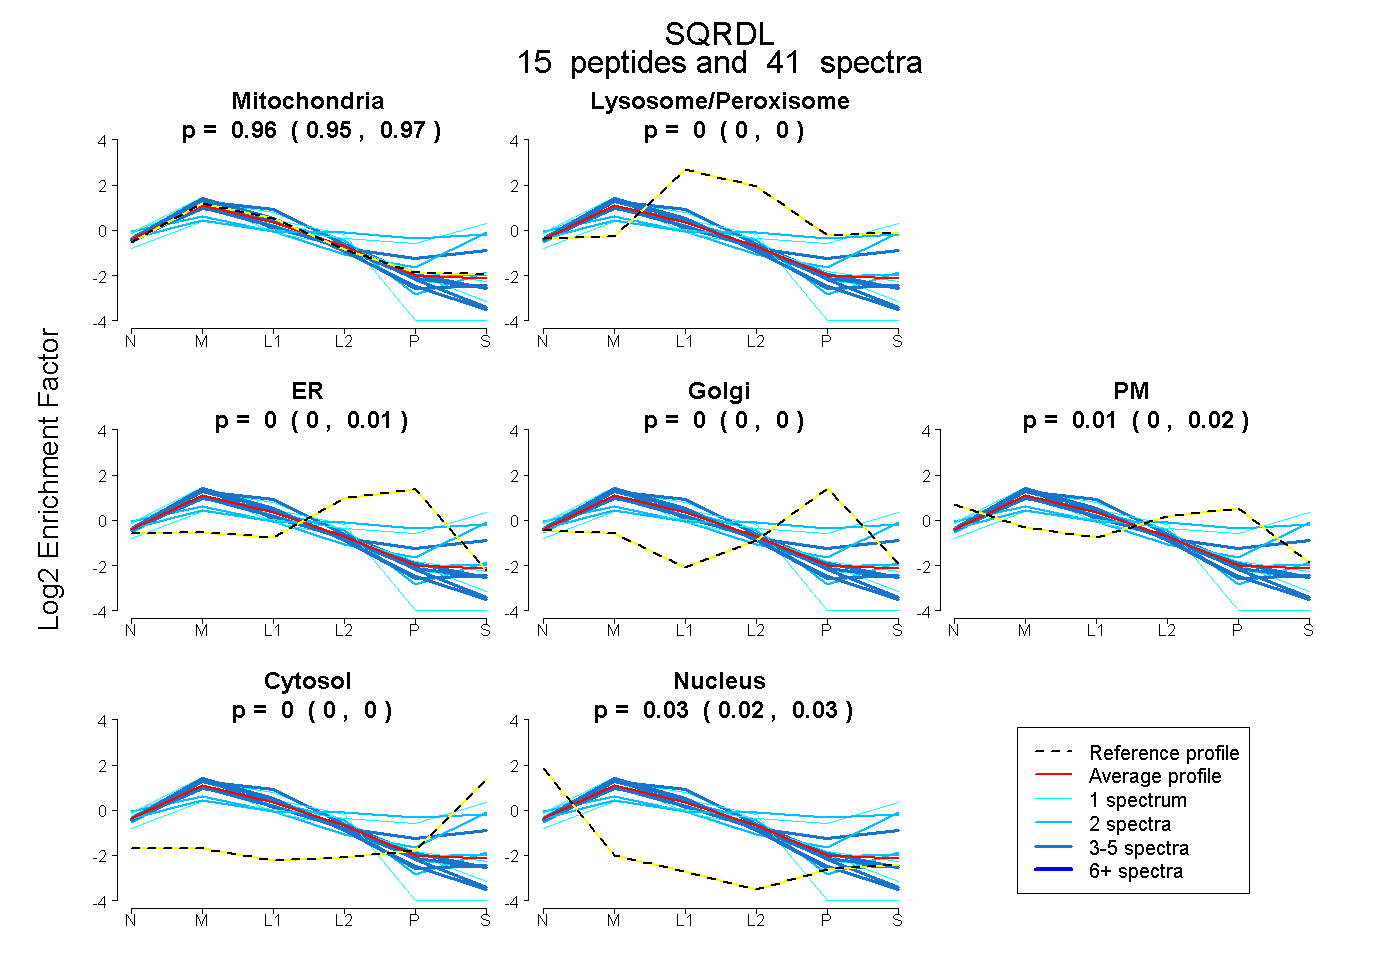
0.949 | 0.969
0.000 | 0.000
0.000 | 0.014
0.000 | 0.000
0.000 | 0.021
0.000 | 0.000
0.021 | 0.032
20peptides
spectra
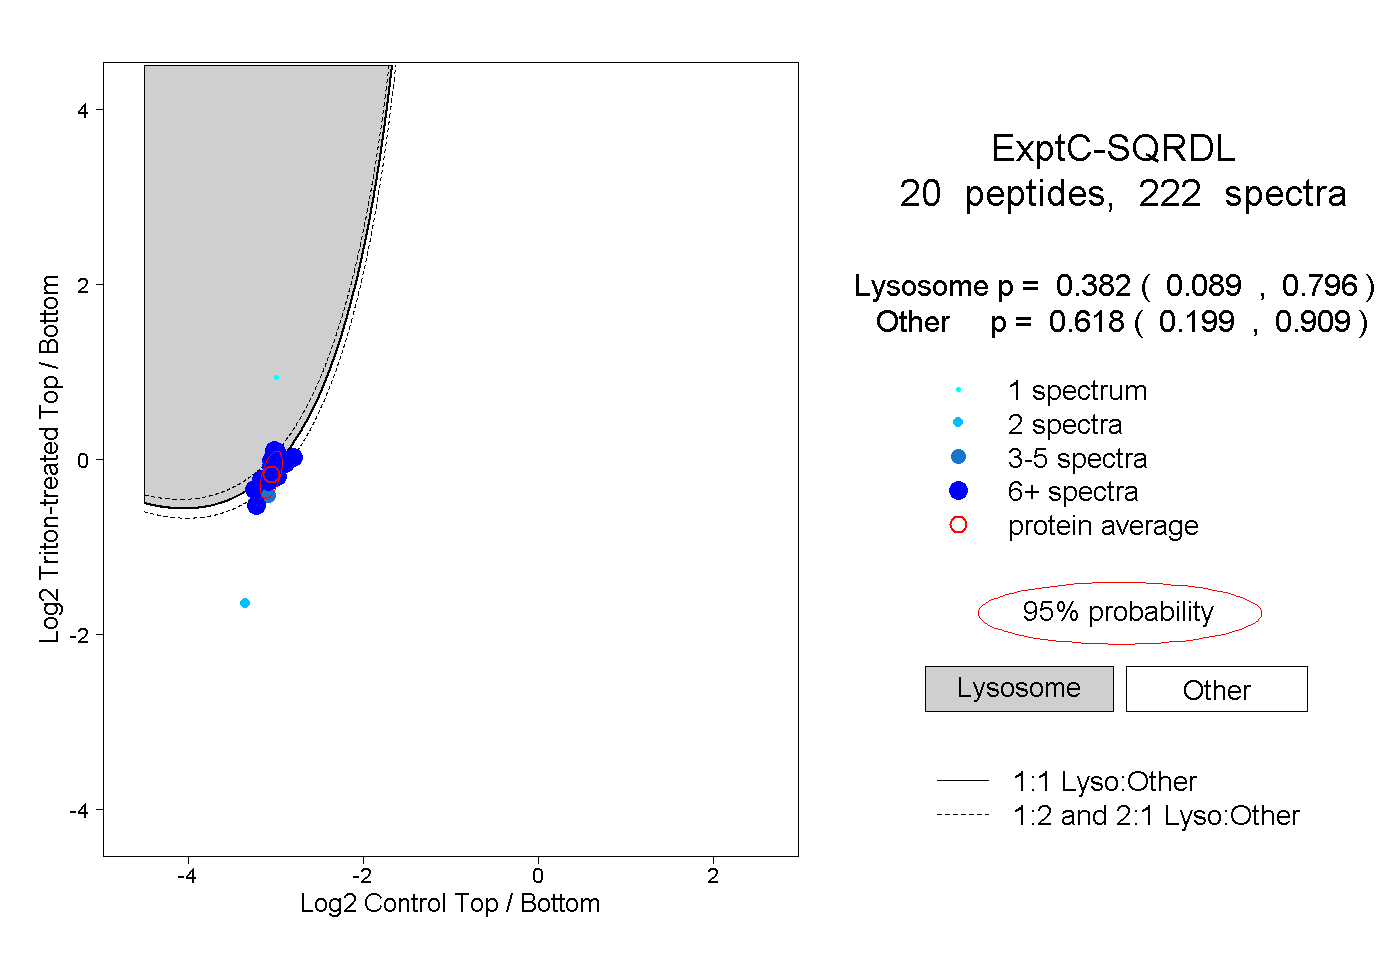
0.089 | 0.796
0.199 | 0.909
11peptides
spectra
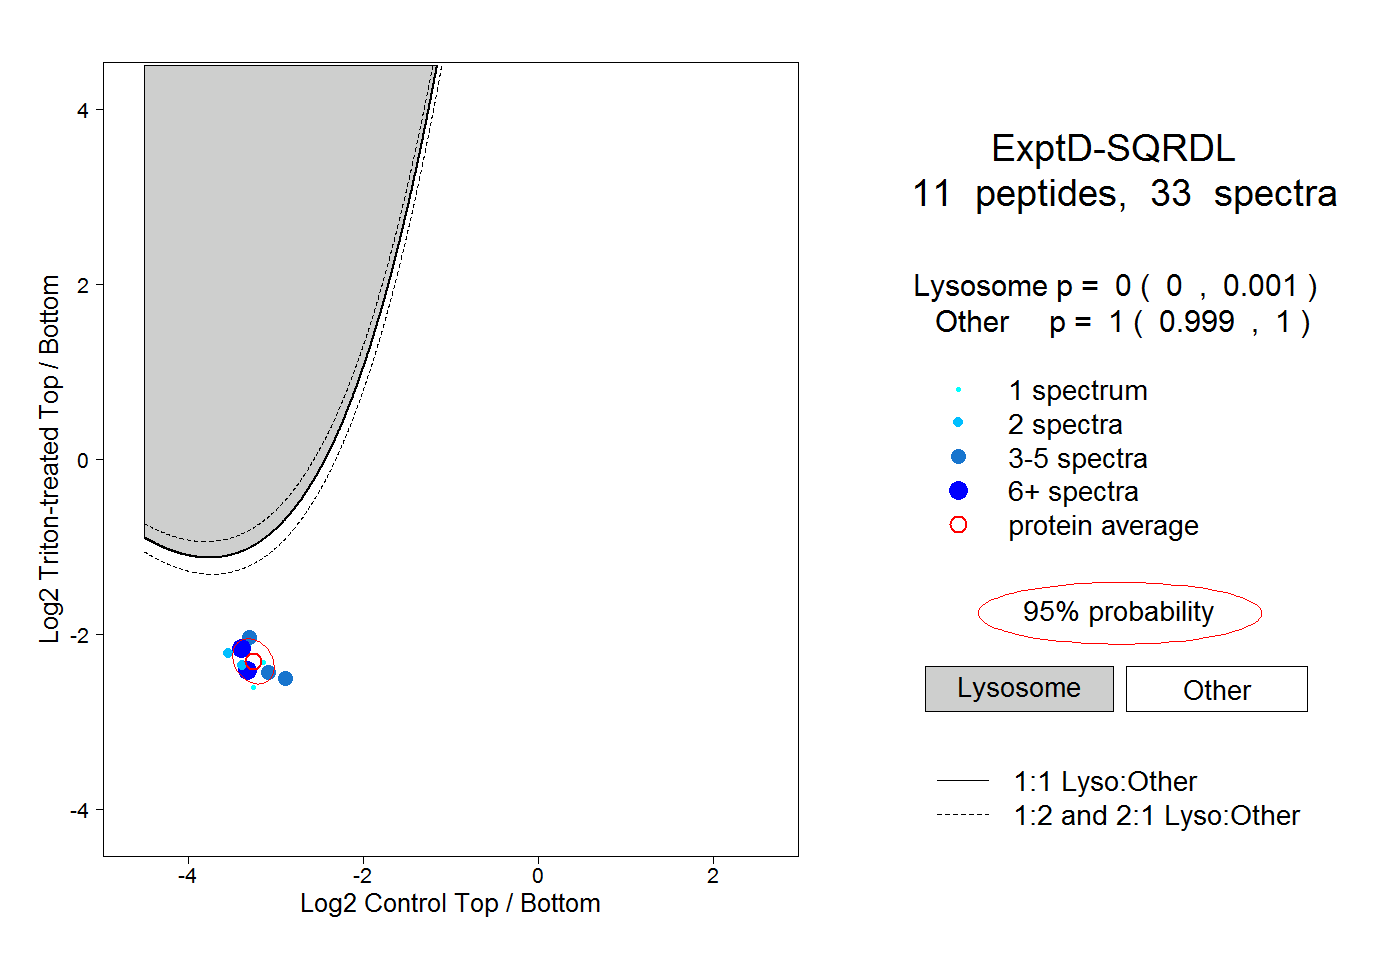
0.000 | 0.001
0.999 | 1.000