 19
19peptides
spectra
0.682 | 0.690
0.111 | 0.120
0.000 | 0.000
0.000 | 0.000
0.000 | 0.000
0.192 | 0.203
0.000 | 0.000
0.000 | 0.000
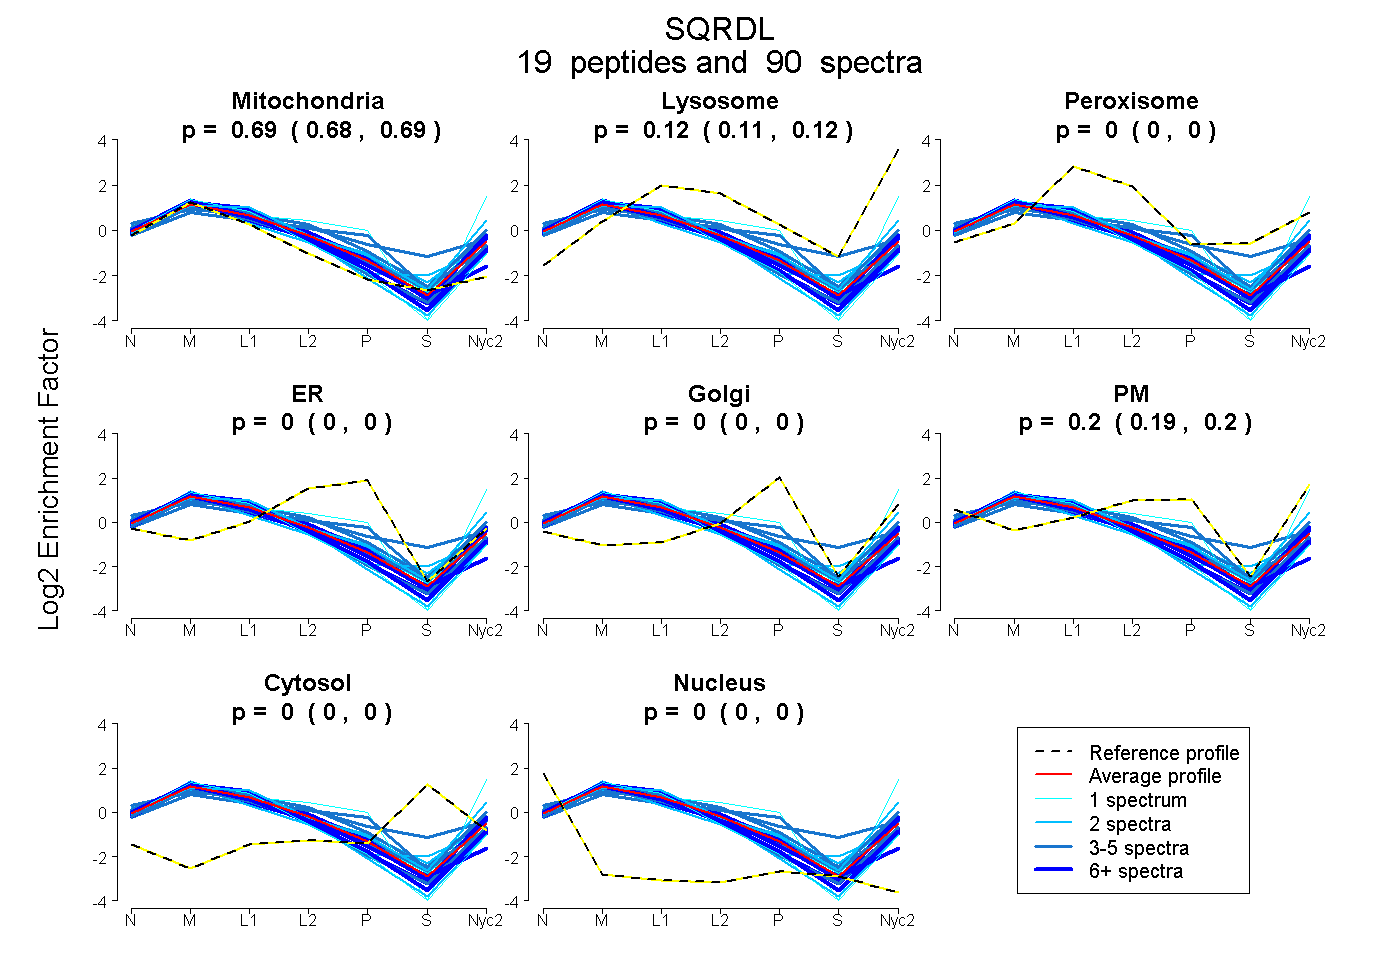
| Plot | Mito | Lyso | Perox | ER | Golgi | PM | Cytosol | Nucleus | |||||
| Expt A |
19 peptides |
90 spectra |
|
0.686 0.682 | 0.690 |
0.116 0.111 | 0.120 |
0.000 0.000 | 0.000 |
0.000 0.000 | 0.000 |
0.000 0.000 | 0.000 |
0.198 0.192 | 0.203 |
0.000 0.000 | 0.000 |
0.000 0.000 | 0.000 |
| 6 spectra, HNLIEVR | 0.751 | 0.042 | 0.000 | 0.000 | 0.000 | 0.207 | 0.000 | 0.000 | ||
| 6 spectra, YADALQEIIR | 0.790 | 0.046 | 0.000 | 0.000 | 0.000 | 0.164 | 0.000 | 0.000 | ||
| 1 spectrum, EGNALFTFPNTPVK | 0.293 | 0.172 | 0.000 | 0.000 | 0.000 | 0.536 | 0.000 | 0.000 | ||
| 1 spectrum, YDGYTSCPLVTGYNR | 0.836 | 0.023 | 0.000 | 0.000 | 0.000 | 0.141 | 0.000 | 0.000 | ||
| 3 spectra, STLSVIPSGVQWIQDR | 0.787 | 0.128 | 0.000 | 0.000 | 0.000 | 0.085 | 0.000 | 0.000 | ||
| 6 spectra, GYWGGPAFLR | 0.786 | 0.134 | 0.000 | 0.000 | 0.000 | 0.080 | 0.000 | 0.000 | ||
| 2 spectra, NVSVNYK | 0.844 | 0.048 | 0.000 | 0.000 | 0.000 | 0.108 | 0.000 | 0.000 | ||
| 2 spectra, IGSNYSVK | 0.785 | 0.171 | 0.000 | 0.000 | 0.000 | 0.007 | 0.037 | 0.000 | ||
| 18 spectra, IMYLSEAYFR | 0.688 | 0.173 | 0.000 | 0.000 | 0.000 | 0.140 | 0.000 | 0.000 | ||
| 2 spectra, ALQDFK | 0.587 | 0.048 | 0.123 | 0.000 | 0.000 | 0.242 | 0.000 | 0.000 | ||
| 4 spectra, CAGAPQK | 0.505 | 0.000 | 0.142 | 0.000 | 0.000 | 0.353 | 0.000 | 0.000 | ||
| 13 spectra, ISMYLMK | 0.653 | 0.163 | 0.000 | 0.000 | 0.000 | 0.184 | 0.000 | 0.000 | ||
| 4 spectra, TAAAVAAQSGILDR | 0.708 | 0.040 | 0.060 | 0.000 | 0.000 | 0.192 | 0.000 | 0.000 | ||
| 2 spectra, YPNVFGIGDCTNLPTSK | 0.564 | 0.267 | 0.000 | 0.000 | 0.000 | 0.169 | 0.000 | 0.000 | ||
| 1 spectrum, GLPEGFAYPK | 0.681 | 0.101 | 0.024 | 0.000 | 0.000 | 0.194 | 0.000 | 0.000 | ||
| 7 spectra, VAELNPDQNCIR | 0.799 | 0.000 | 0.061 | 0.107 | 0.000 | 0.033 | 0.000 | 0.000 | ||
| 4 spectra, HFYQPIWTLVGAGAK | 0.405 | 0.011 | 0.276 | 0.000 | 0.089 | 0.114 | 0.105 | 0.000 | ||
| 4 spectra, ELSSSDR | 0.628 | 0.075 | 0.036 | 0.000 | 0.000 | 0.261 | 0.000 | 0.000 | ||
| 4 spectra, TISLIMK | 0.489 | 0.139 | 0.000 | 0.085 | 0.000 | 0.287 | 0.000 | 0.000 |
| Plot | Mito | Lyso or Perox | ER | Golgi | PM | Cytosol | Nucleus | ||||||
| Expt B |
15 peptides |
41 spectra |
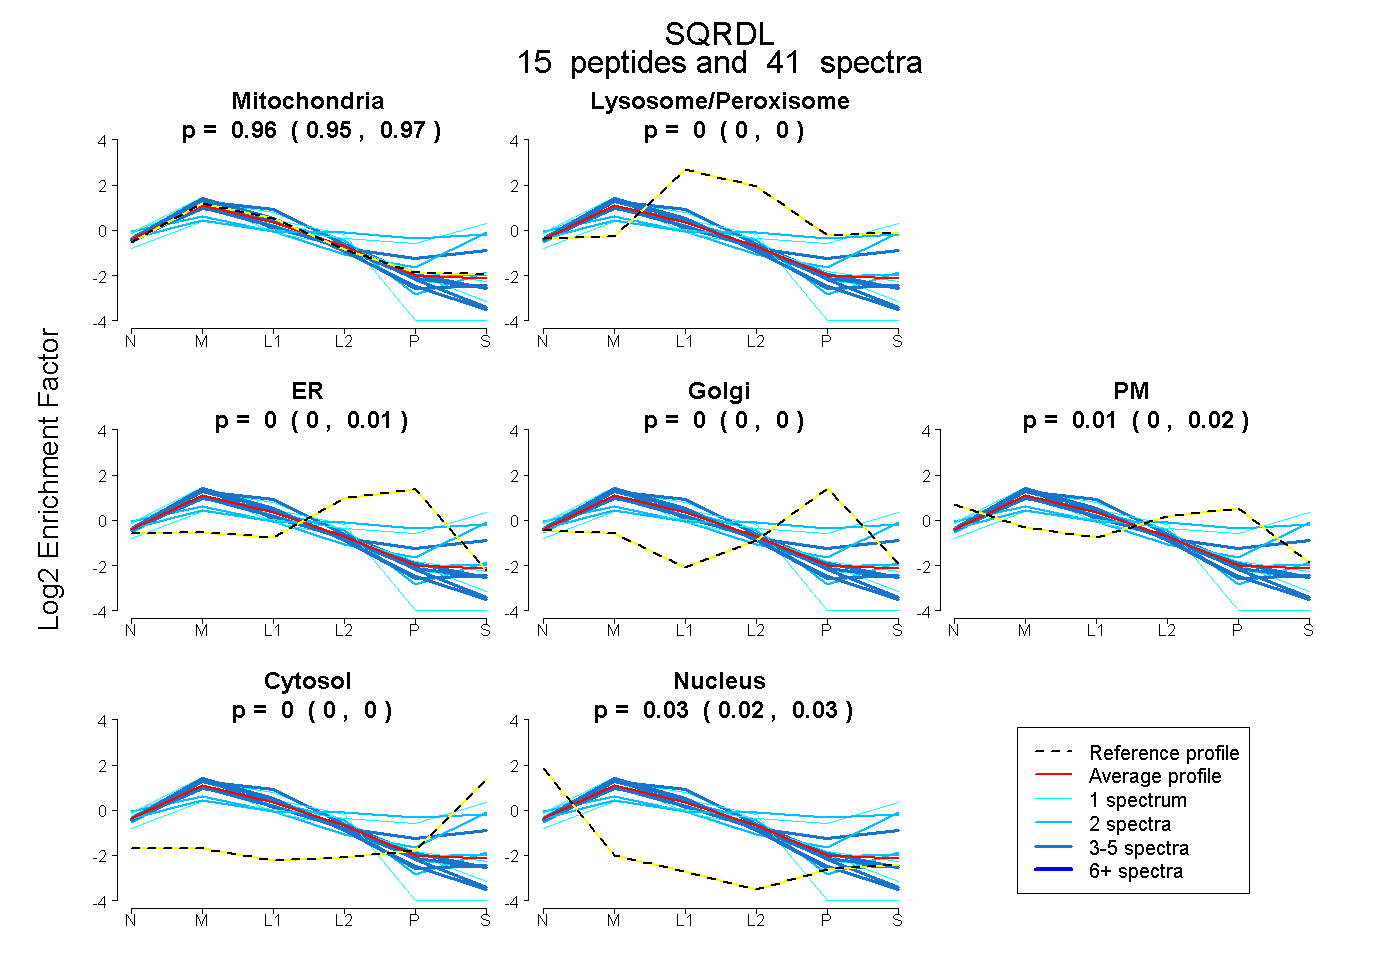 |
0.961 0.949 | 0.969 |
0.000 0.000 | 0.000 |
0.002 0.000 | 0.014 |
0.000 0.000 | 0.000 |
0.010 0.000 | 0.021 |
0.000 0.000 | 0.000 |
0.027 0.021 | 0.032 |
|||
| Plot | Lyso | Other | |||||||||||
| Expt C |
20 peptides |
222 spectra |
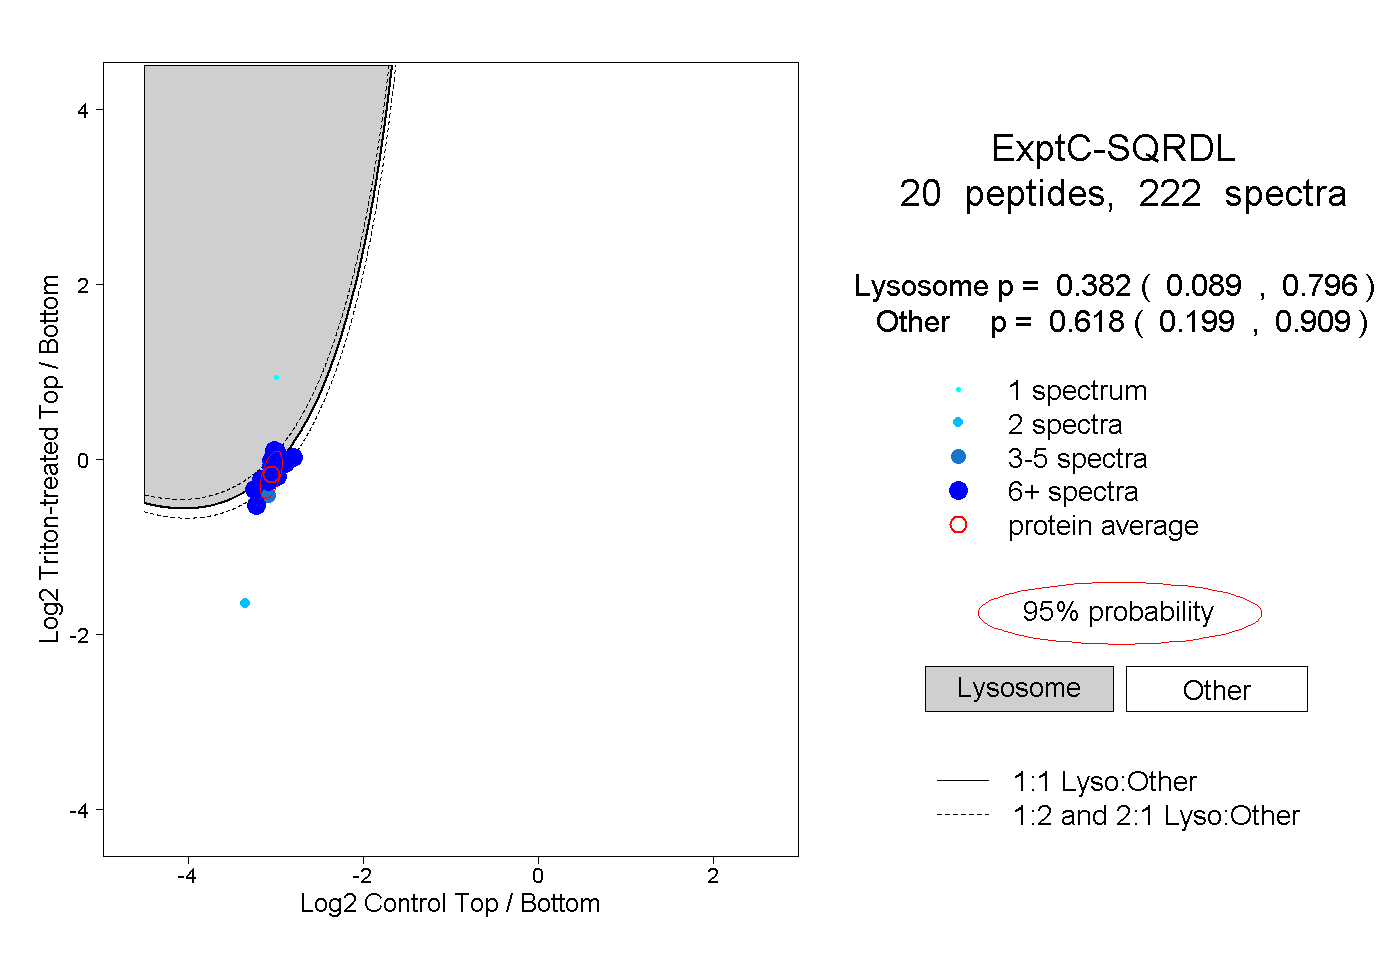 |
0.382 0.089 | 0.796 |
0.618 0.199 | 0.909 |
||||||||
| Plot | Lyso | Other | |||||||||||
| Expt D |
11 peptides |
33 spectra |
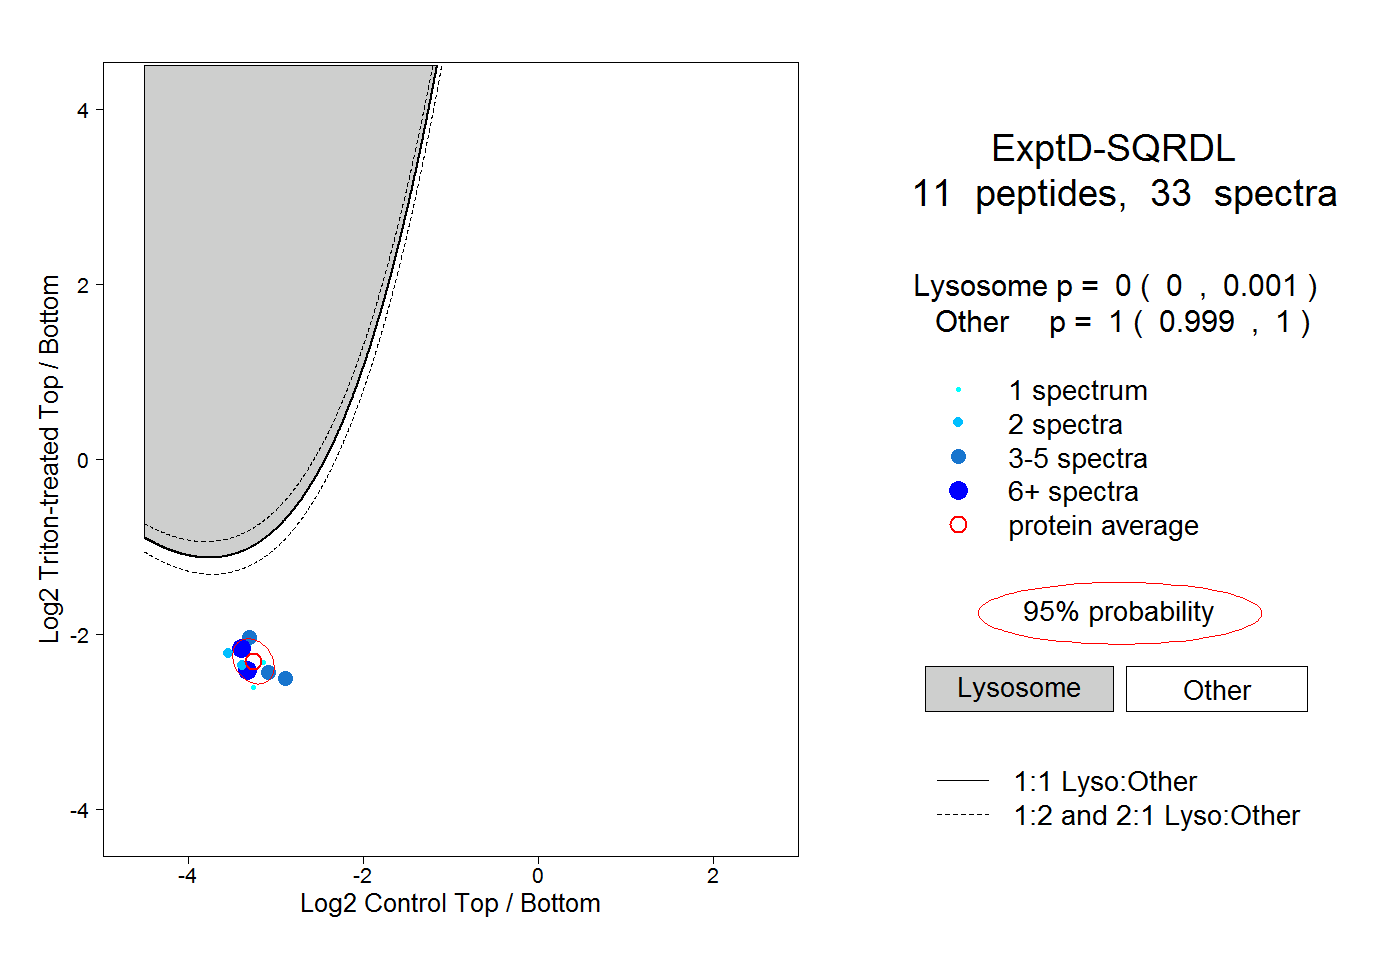 |
0.000 0.000 | 0.001 |
1.000 0.999 | 1.000 |